 Stay
Stay 
Trading Conditions
Products
Tools


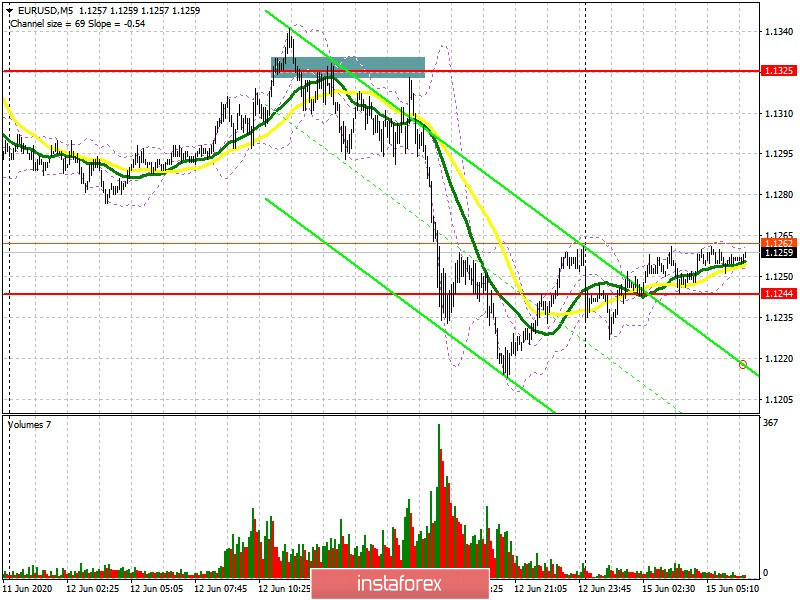
To open long positions on EUR/USD, you need:
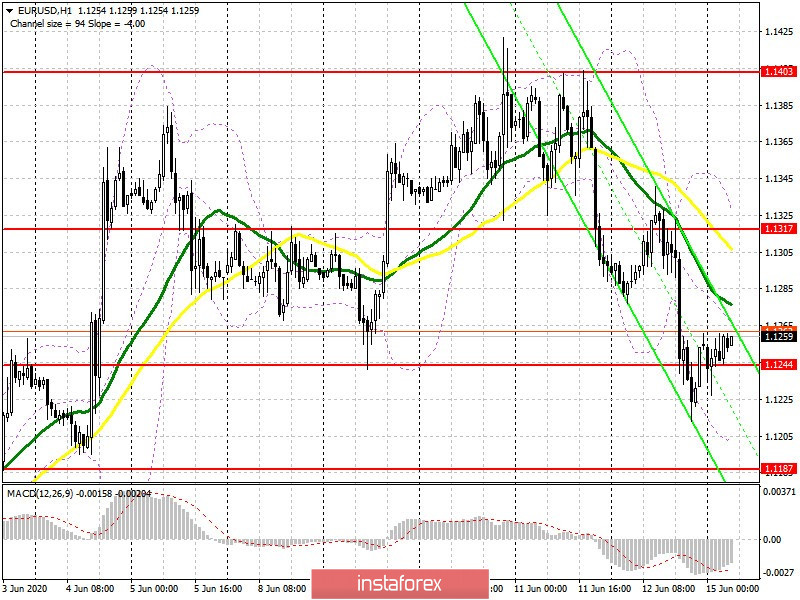
We received just a few excellent signals to sell the euro last Friday, which, judging by the schedule, can start a rather deep fall in the second half of this month. If you look at the 5-minute chart, you will see a false breakout, which was formed at 1.1325 in the first half of the day, after the release of the report on the volume of industrial production in the eurozone. This false breakout, which I mentioned in my forecast, was a signal to open short positions in euros. But even if you did not manage to enter the sales at the European session, a similar attempt by the bulls to return to the market was made in the afternoon and a second resistance test of 1.1325 also signaled the opening of short positions, which caused the pair to fall to a low of 1.1244 around which the main trade is now conducted. If you look at the hourly chart, you can see how the bulls are protecting the 1.1244 area and forming a false breakout on it in the morning will be a signal to open long positions, the target of which will be the resistance 1.1317, a little below which the moving average is going to limit the pair's upward potential. The bulls will also aim for the test of the high of 1.1403, where I recommend taking profits, but getting to it will not be so simple. If pressure on the euro continues, and most likely we will see the market shaking around the level of 1.1244 today, since important fundamental statistics are not published, then it is best to open long positions in EUR/USD after updating support at 1.1187, or immediately to rebound from more a large low of 1.1119, based on a correction of 30-40 points within the day.
To open short positions on EUR/USD, you need:
Bears continue to put pressure on the euro, plunging the pair more and more into a new downward correction channel. Today, the sellers' goal is to return and consolidate EUR/USD below the level of 1.1244, which will increase the pressure on the pair and lead to its downward movement to the area of lows 1.1187 and 1.1119, where I recommend taking profits. This is especially possible due to the lack of important fundamental statistics at the beginning of this week. If the bulls are more active in their actions, then with an upward correction it is best to open short positions after the resistance update of 1.1317, but I recommend selling EUR/USD immediately for a rebound only from the last week's local high in the 1.1403 area, counting on a downward correction of 30 -40 points within the day.
Signals of indicators:
Moving averages
Trade is conducted below 30 and 50 moving average, which indicates a further decline in the euro.
Note: The period and prices of moving averages are considered by the author on the hourly chart H1 and differs from the general definition of the classic daily moving averages on the daily chart D1.
Bollinger bands
In case of growth, the upper border of the indicator in the region of 1.1317 will act as resistance. You can open long positions after updating the lower border in the 1.1195 area.
Description of indicators
InstaForex analytical reviews will make you fully aware of market trends! Being an InstaForex client, you are provided with a large number of free services for efficient trading.

