 Stay
Stay 
Trading Conditions
Products
Tools


The GBP/USD pair moved up and tested the historical resistance level of 1.2781 (yellow dashed line) last week which was followed by a price decline. In turn, it tested the pullback level of 38.2% - 1.2528 (red dashed line) while moving down the market. Most likely, the price may continue to decline this week.
Trend analysis.
This week, the price from the level of 1.2535 (closing of the last weekly candle) will decline with the goal of reaching a pullback level of 50%, 1.2441 (red dashed line). It is possible to break down this line with the following target of 1.2354 (red dashed line). An upward movement is possible with the target of 1.2511 - 21 average EMA (black thin line) from this level.
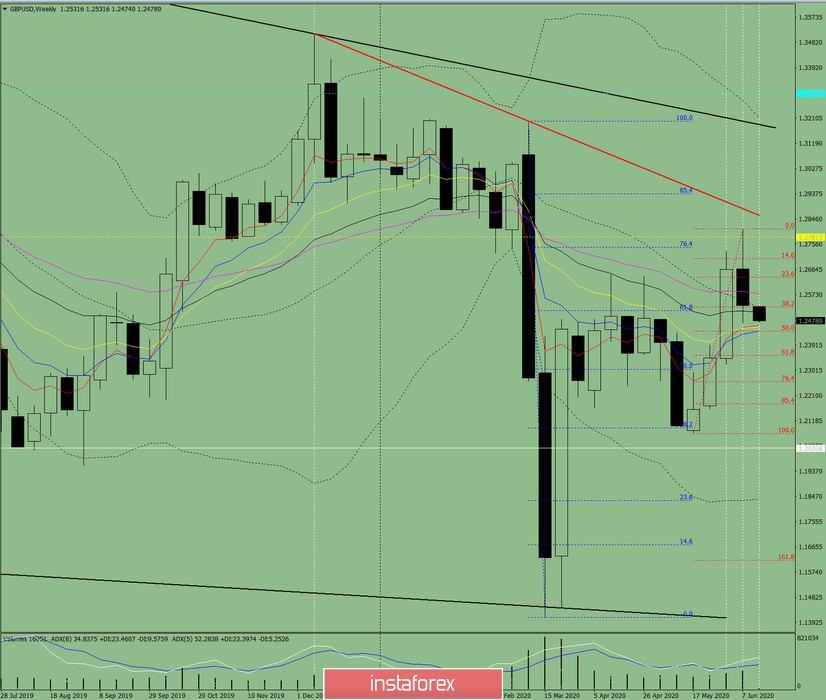
Fig. 1 (weekly schedule).
Comprehensive analysis:
- indicator analysis - down;
- Fibonacci levels - down;
- volumes - down;
- candlestick analysis - down;
- trend analysis - up;
- Bollinger Lines - down;
- monthly chart - up.
The conclusion of a comprehensive analysis is a downward movement.
The overall result of calculating the candle of the GBP/USD currency pair according to the weekly chart: the price of the week will most likely have a downward trend with the absence of the first upper shadow of the weekly black candlestick (Monday - down) and the presence of the second lower shadow (Friday - up).
The first upper goal is to reach the pullback level of 50% - 1.2441 (red dashed line). It is possible to break down this line with the following target of 1.2354 (red dashed line). From this level, growth is possible with the target of 1.2511 - 21 average EMA (black thin line).
An unlikely, but possible scenario: the price will increase with the target of the upper fractal 1.2811 (red dashed line) from a pullback level of 50% - 1.2439 (red dashed line).
InstaForex analytical reviews will make you fully aware of market trends! Being an InstaForex client, you are provided with a large number of free services for efficient trading.

