 Stay
Stay 
Trading Conditions
Products
Tools


From the point of view of complex analysis, we see a sharp slowdown in price within the important range level. Let's talk about the details now.
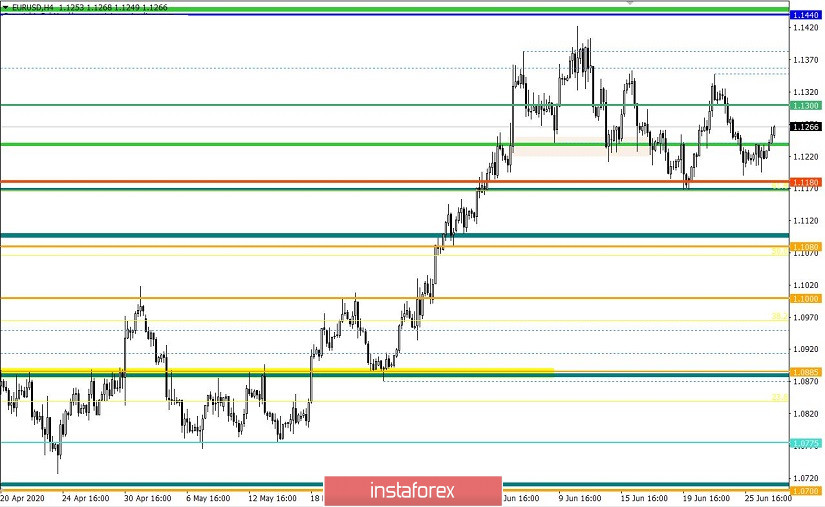
Last trading week began with a corrective move from the range level of 1.1180. Against the background of local long positions, the price managed to return to the area of 1.1300/1.1350 from that level, puting the recovery process at high risk for a moment. Buyers did not succeed in breaking the downward trend from the area of trade forces interaction at 1.1440/1.1500. At that point, there was a reverse move, which led to a 87% recovery relative to the corrective movement, affecting, as a result, the area of the range level of 1.1180 (1.1190).
The existing fluctuation practically coincides with the correlative GBPUSD trading instrument, which has a similar price development process, but with an only difference. The recovery of the downward movement in the pound sterling is 68%, while this figure is only 39% in the euro - that is, the quote is still fluctuating at the conditional high of the upward trend as of May 18. Based on the indicators, traders devote close attention to the range level of 1.1180. Thanks to this level, it will be possible to determine the market sentiment for the coming trading weeks. It means that market participants consider two scenarios: the first indicates a consistent recovery process, which will lead the quote to a range of fluctuations at 1.0775//1.0885//1,1000; the second scenario, on the contrary, considers the formation of a new range at 1,1180//1,1300//1,1500. Throughout it all, the range level of 1.1180 is of particular concern, since a possible scenario will unfold depending on the quote and price fixing points.
If we take a closer look at Friday trading day, we can notice horizontal movement in an alternating range of 20–40 pips, where market participants were feeling the pressure from the range level of 1.1180.
In terms of volatility, there has been a slowdown activity for the second day in a row, while the dynamics indicator for Friday turned out to be the lowest in 23 trading days. A sharp decline in activity on a systematic basis is considered to be a signal of speedy acceleration, where the range of 1.1180 will become a catalyst for trading forces.
As discussed in the previous review, traders considered the main short positions lower than the level of 1.1165. However, it did not happen, and the quote continued to stand still.
Overall, if we focus on the daily chart, we can see the low rate of price change over the last 13 trading days, which signals the uncertainty of market participants to a sharp change in the trend.
As for the news background on Friday, data on personal income and spending in the United States was delivered. Thus, income in the US fell by 4.2%, while spending grew by 8.2%.
In terms of informational background, we have a planned speech by the head of the European Central Bank, Christine Logard, where, during a video call, she admitted that the world economy could already pass the bottom of the crisis, unless, of course, a second wave of coronavirus infection breaks out.
A cause for concern was a new daily increase in coronavirus cases in the United States, which was recorded on June 26. Thus, the US confirmed 45,242 new cases per day, which has been an absolute record since the beginning of the epidemic. Interestingly, the total number of COVID-19 cases in the US is 2,448,617, of which 128,437 are lethal.
Today, in terms of the economic calendar, we have the United States existing home sales for May, which are expected to increase by 18.9%.

Further development
Analyzing the current trading chart, you can see a slight pullback towards the 1.1270 mark, where the quote's dynamics is similar to that of the end of last week. The concentration of trading forces within the range of 1.1180 will continue to exert pressure on the market, which will subsequently affect the dynamics and speculative activity.
We can assume that if the quote fails to consolidate higher than 1.1275, there is a chance of a price return to the range of 1.1190/1.1240. This is an accumulation signal that will be oriented to the range of 1.1180.
Trading recommendations based on the above information:
- Consider buy deals higher than 1.1275, towards 1.1300-1.1340
- Consider selly deals lower than 1.1235, towards 1.1200-1.1190.
The main positions will take place if the price consolidates below 1.1165 on the four-hour time frame.
Indicator analysis
Analyzing a different sector of timeframes (TF), we see that the indicators of technical tools at minute and hour intervals signal buy deals due to a local price rebound. The daily interval signals a neutral sentiment due to the concentration of prices near the range level.
Volatility per week / Measurement of volatility: Month; Quarter; Year
Volatility measurement reflects the average daily fluctuation calculated for the Month / Quarter / Year.
(June 29 was built taking into account the time of publication of the article)
The current volatility is 49 pips, which is 11% higher than the dynamics over the past Friday. Most likely, that the market will continue to accelerate. As a result, there might be speculative excitement, and the price might reachan average daily volatility.
Key levels
Resistance zones: 1.1300; 1.1440 / 1.1500; 1.1650 *; 1.1720 **; 1.1850 **; 1,2100
Support zones: 1,1180; 1.1080 **; 1,1000 ***; 1.0850 **; 1.0775 *; 1.0650 (1.0636); 1,0500 ***; 1.0350 **; 1,0000 ***.
* Periodic level
** Range Level
*** Psychological level
InstaForex analytical reviews will make you fully aware of market trends! Being an InstaForex client, you are provided with a large number of free services for efficient trading.

