 Stay
Stay 
Trading Conditions
Products
Tools


The trading week is coming to an end and it is time to sum up the preliminary results. An attempt to radically change the medium-term trend led to a discussion among technical analysis specialists after the local price fixed above the 1.1440 level. There were a lot of judgments and theories, but everyone agreed on the fact that the market is charged with emotions. This is a basis for movements that will hardly carry drastic changes.
Let's analyze the past day, which would interest even the laziest trader. We can see high speculative activity. At the beginning of the European session, the quote was moving downwards. However, it unexpectedly changed its direction around the 1.1380 level. At this level, a lot of long positions were opened. This returned the euro/dollar pair to 1.1440. After touching this important level, the quote reversed. After that, a lot of short deals were opened.
The reverse V-shaped formation appeared after such a rally. The most interesting thing is that the downward mood still prevails despite local price jumps.
In terms of volatility, there is a discrepancy. Thus, on the one-minute and one-hour charts, we can see acceleration that confirms the fact that speculators are still in the market. The daily chart, on the contrary, has an indicator close to the daily average of 71 (76) pips, which points to stabilization.
The discrepancies are probably related to the emotional component of the market, where short-term intervals are of great importance for traders.
As discussed in the previous review, market participants are more likely to consider downward development, but they are always ready for local jumps.
In general, it is necessary to mention that the single currency is extremely overbought. The price fluctuation near the high of the current year drums up traders' interest in a downward move.
The ECB's meeting was the main event of the day. The regulator remained the key interest rate at the zero level and left the parameters of the special asset purchase program PEPP [Pandemic Emergency Purchase program] unchanged.
During the press conference, ECB chief Christine Lagarde said that she expected economic activity in the eurozone to recover in the third quarter of this year. She also added that they still needed large-scale monetary stimulus measures to support the economic recovery and ensure medium-term price stability.
"Incoming information since our last monetary policy meeting in early June signals a resumption of euro area economic activity, although the level of activity remains well below the levels prevailing before the coronavirus (COVID-19) pandemic and the outlook remains highly uncertain," Christine Lagarde said.
Thus, monetary policy remains the same, and the ECB's head repeated the already known assumptions about the recovery.
At the same, the US retail sales data was published. In June, the indicator advanced by 1.1% on a yearly basis. Economists had expected a drop of 3.0%. On a monthly basis, retail sales rose by 7.3%.
After that, the US revealed the unemployment claims figures which were below the forecast. Thus, the number of the first-time claims dropped to 1,300,000 from 1,310,000. Economists had expected a decline to 1,250,000. The number of continuous claims decreased to 17,338,000 from 17,760,000 whereas analysts had forecast a drop to 17,600,000.
Today, the eurozone inflation report was published. The data was in line with the forecast. Thus, the indicator advanced to 0.3% from 0.1%. Amid the news, the quote dropped to the area of 1.1400/1.1440.
The US will report on its construction sector later today. Construction of new homes may increase by 12.9%, and the number of building permits may rise by 2.5%. The US dollar could gain in value after the publication.
The overall news background has a positive effect on the US economy. However, speculators did not give an opportunity to take advantage of such optimistic figures.
Next trading week is almost empty in macroeconomic events. Data on the US unemployment claims will be the only important report of the week. However, the market will still be under pressure of the news background.
Below you can find the most important events of the next week:
Wednesday, July 22nd
US – Existing home sales (June)
Thursday, July 23rd
US – Unemployment claims
Friday, July 24th
EU – Manufacturing PMI (July)
US – New Home Sales (June)
Further development of the pair
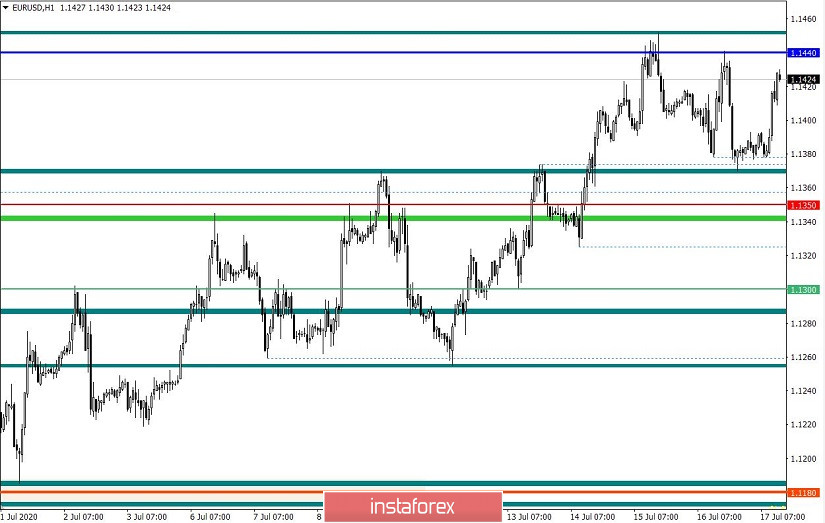
Analyzing the current trading chart, we can see another round of speculation, which drove the quote to the area of 1.1400/1.1440. However, for how long it will last is the main question.
There is an assumption that speculators will feel pressure within the area of 1.1440, where long positions will be systematically fixed. This may lead to a new round of downward movement towards 1.1375. These are local operations amid a strong emotional background. To hit higher levels, the price should break the current year's high.
If the price rebounds from the area of 1.1440, it may approach 1.1375. If the pair fixes below the mentioned level, deals can be held up to the level of 1.1350.
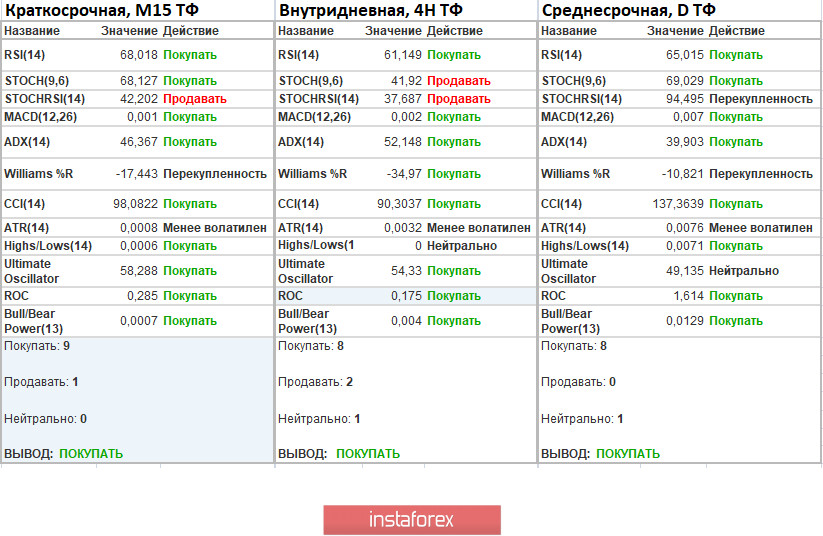
Indicator analysis
Analyzing different time frames, we can see that there are buy signals on the one-minute and one-hour charts. The daily chart reflects the general direction of the market.
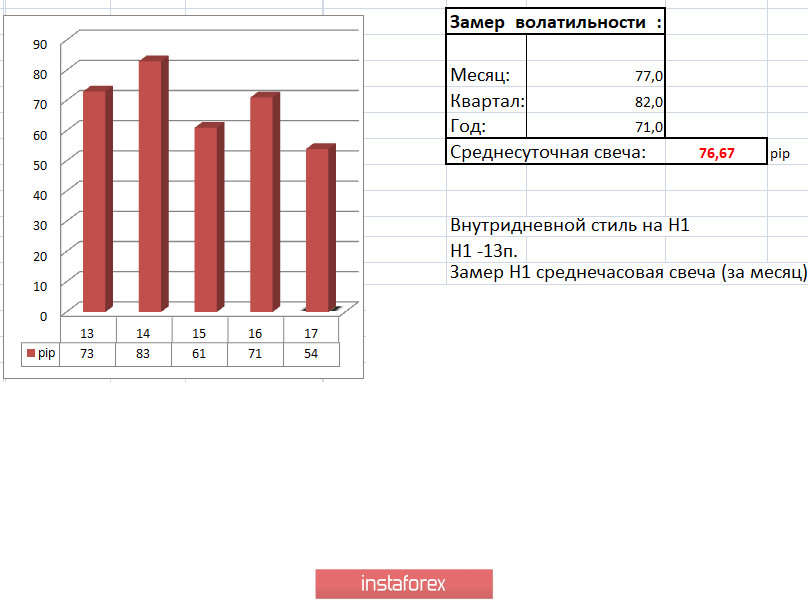
The volatility for the week / Measurement of volatility: Month; Quarter; Year
The volatility measurement reflects the average daily fluctuation calculated for the Month / Quarter / Year.
The current time volatility is 5 pips, which is 28% lower than the daily average. We can assume that in the wake of speculation, volatility may continue growing, exceeding the average dynamics indicator.
Key levels:
Resistance zones: 1.1440/1.1500; 1.1650*; 1.1720**; 1.1850**; 1.2100
Support zones: 1.1350; 1.1250*;1.1180**; 1.1080; 1.1000***; 1.0850**;1.0775*; 1.0650 (1.0636); 1.0500***; 1.0350**; 1.0000***.
* Periodic level
* * Range level
***Psychological level
To be aware of all trends, read the burning forecast for the GBP/USD pair following the link
You may also look through the following analysis: Brief trading recommendations for EUR/USD and GBP/USD and USD/CAD on 07/17/20
InstaForex analytical reviews will make you fully aware of market trends! Being an InstaForex client, you are provided with a large number of free services for efficient trading.

