 Stay
Stay 
Trading Conditions
Products
Tools


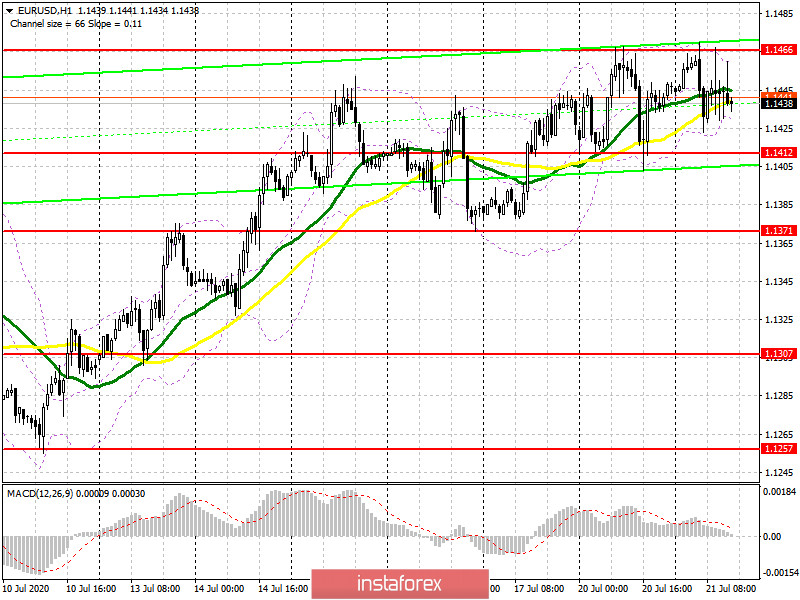
To open long positions on EURUSD, you need:
In my morning forecast, I paid attention to sales from the level of 1.1466 when the pair returns to this range. If you look at the 5-minute chart, you will see how after the news of the EU summit, the euro retreated down from the level of 1.1466, but then returned to it, testing it from the bottom up and forming a good signal to open short positions. Now, as long as trading is conducted below this range, the pressure on the euro will continue, and the market will remain on the side of sellers of the euro. Bulls still need a breakout and consolidation above the resistance of 1.1466, which will be a signal to open long positions in the expectation of continuing the upward trend to the maximum area of 1.1514 and 1.1539, where I recommend fixing the profits. If the pressure on the euro continues in the second half of the day, it is best to postpone purchases until the formation of a false breakout in the area of 1.1412. Larger buyers will protect the minimum of 1.1371, as the further direction of the market depends on it. Therefore, you can open long positions from this area immediately on the first test, counting on a correction of 25-30 points within the day.

To open short positions on EURUSD, you need:
Bears completely coped with the morning task forming a good entry point into short positions. As I noted above, until the pair is trading below the area of 1.1466, we can expect a decline in EUR/USD to the support area of 1.1412, which acts as the middle of the channel. Much will depend on the further reaction of traders to the news from the EU summit, as no other important fundamental data is expected. Fixing below the level of 1.1412 forms an additional signal to sell EUR/USD, however, the longer-term goal will be to break the minimum of 1.1371, which will lead to a complete break in the bull market and increase pressure on the pair, opening a direct road to the lows of 1.1307 and 1.1257, where I recommend fixing the profits. If the bulls will be stronger and reactive sales growth from the resistance of 1.1466 seen, it is best to defer short positions to update the maximum 1.1514 or sell EUR/USD immediately on a rebound from the larger resistance 1.1569, based on a correction of 25-30 points intra-day.
Signals of indicators:
Moving averages
Trading is conducted in the area of 30 and 50 daily moving averages, which indicates market uncertainty with the future direction.
Note: The period and prices of moving averages are considered by the author on the hourly chart H1 and differ from the general definition of the classic daily moving averages on the daily chart D1.
Bollinger Bands
A break in the upper limit of the indicator around 1.1466 will strengthen the demand for the euro. A breakdown of the lower border in the area of 1.1425 will lead to a larger sell-off of the euro.
Description of indicators
InstaForex analytical reviews will make you fully aware of market trends! Being an InstaForex client, you are provided with a large number of free services for efficient trading.

