 Stay
Stay 
Trading Conditions
Products
Tools


Just a couple of days ago, the Federal Reserve informed everyone that we are facing the deepest economic downturn in almost all history. And to be honest, the US central bank was not lying. The fact is that GDP data have been recorded only since 1948. Anything about economic growth or recession until this time is nothing more than a kind of speculative assumption. So yesterday we witnessed a truly historic event. The economic downturn in the United States was the deepest in the history of such observations. And although it turned out to be slightly less than predicted, these differences are so insignificant that they no longer mattered. The very fact of such large-scale losses is the most serious reason for panic. And the dollar was not saved from further weakening either by the fact that the data practically coincided with forecasts, nor by its incredible oversold.

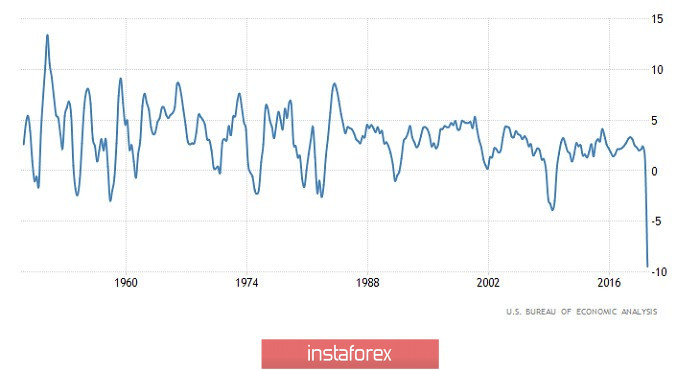
It is clear that now everyone is talking about this only. They speak only about the quarterly GDP, the decline of which was as much as -32.9%. A decline of -33.0% was predicted. Although the annual data are much more interesting, as they give a much more complete picture. But in any case, even the quarterly data is very impressive. Such a large-scale recession has never been observed. The previous record of such quarterly GDP decline was recorded back in 1958. More precisely, in the first quarter of 1958. Then, compared to the fourth quarter of 1957, the GDP decreased by -10.0%. So the current recession is almost three and a half times stronger. But this is only one quarter, compared to the previous quarter. If you look at the annual data, the GDP fell by -9.5%. It's not so scary anymore. However, this is four quarters compared to the previous four quarters. So the scale is much larger. In addition, two quarters fall into these same four quarters, when there was no coronavirus epidemic and even economic growth was observed. And, by the standards of the United States, it is quite good. If we imagine these percentages in absolute terms, we can say that the American economy sank by about $2 trillion over the year. Which already looks much more terrible. So, the previous record of decline in annual terms belongs to 2009. A decline in annual GDP of -3.9% was recorded in the second quarter of 2009. In other words, the current recession is more than twice as large. But the worst thing in all is that at the moment there is a clear deterioration in macroeconomic dynamics. That is, if during almost the entire second quarter there was a gradual improvement in macroeconomic statistics and a feeling was created that the economy was gradually recovering, now the picture is somewhat different. In fact, all the latest macroeconomic data are data for the end of this very second quarter, and the dynamics are clearly frightening. There is every reason to believe that the US economy is not just slowing down, but is entering full-fledged stagnation. Simply put, the latest statistics suggest that the data for the third quarter will be worse than for the second.
GDP Growth Rate (United States):
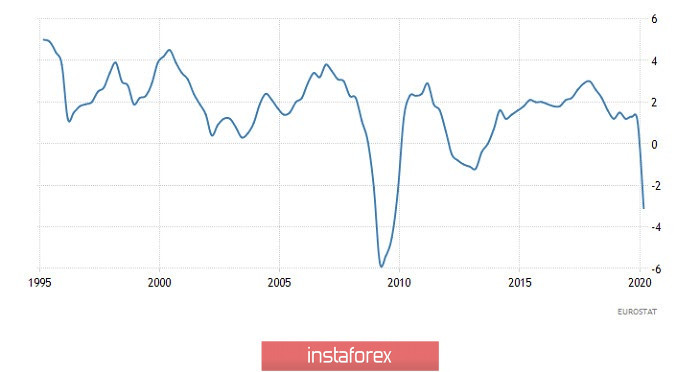
But don't think that the United States is the only one in trouble. Data on the GDP of the euro area will be released today, its forecasts are no better. Although if you look only at the quarterly data, which is what most of the media do, then everything is not so bad. And it's even wonderful in comparison with the United States. According to forecasts, the quarterly decline in GDP should be -12.5%, which looks very, very modest against the background of the United States. However, if you look at the annual data, the picture is completely different. The annualized rate of decline in GDP is expected to be -14.7%, which is almost one and a half times faster than in the United States. So the 2009 record decline will be beaten. Inflation is another negative factor for the euro, which is also published today. This very inflation should decrease from 0.3% to 0.2%. So we can get a combination of GDP decline and inflation. Just a poisonous mixture. And logically, all this should lead to a long-awaited correction. True, there is such a subtle point that market participants are mainly guided by the information presented by the media, and they shout only about quarterly data, not annual data. And as you can see, quarterly GDP data for the euro area looks better than in the United States. Although they do not reflect the whole picture. That is, they form a false idea of what is happening. So if market participants do not see the annual data, then there is a likelihood of continued growth of the euro, which will provoke an even greater gap with reality. This means that the subsequent correction will be much more extensive.
GDP growth rates (Europe):
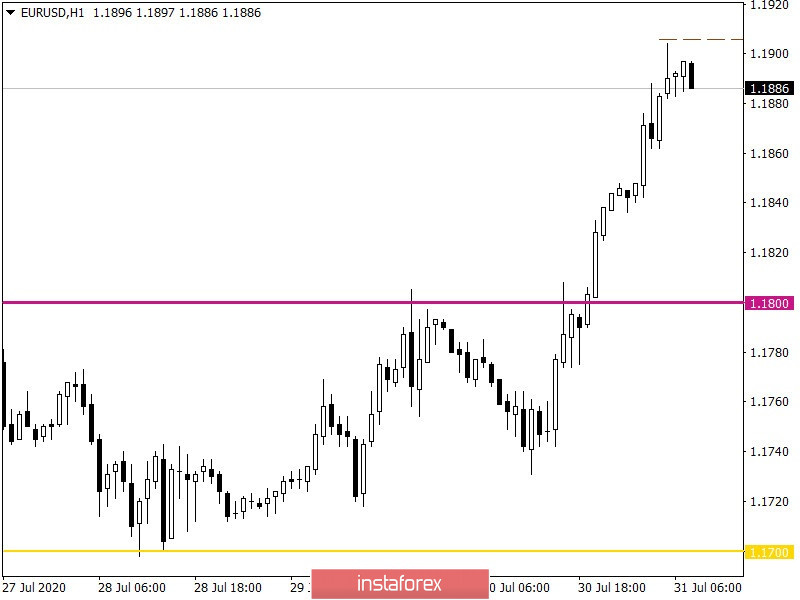
The euro/dollar pair is showing upward interest day after day, updating local highs, where this time it managed to reach the values of 1.1904, and there is an assumption that this is not the end. The overbought value of the European currency is measured on a global scale, but this does not stop speculators, which scares sane traders, who have been predicting a correction to normalize market ticks since last week.
Regarding the dynamics, there is a consistently high volatility indicator, which confirms speculative activity.
If you look at the trading chart in general terms (the daily period), then you can see the vertical movement of the price, which produces a fluctuation in the area of May 2018.
It can be assumed that if the price is consolidated below 1.1870/1.1880, a local price move towards 1.1840-1.1830 may occur, which will be considered a market pullback. To go to the correction stage, the quote needs to be consolidated below 1.1800, which theoretically can lead us to the values of 1.1700-1.1650.
If the speculative hype does not allow you to go to the pullback stage and the quote will be able to consolidate higher than 1.1910, then a variable oscillation within 1.1930/1.1980 is not excluded.
From the point of view of complex indicator analysis, we see that the indicators of technical instruments unanimously signal a purchase by finding the price at the highs of the year.
InstaForex analytical reviews will make you fully aware of market trends! Being an InstaForex client, you are provided with a large number of free services for efficient trading.

