 Stay
Stay 
Trading Conditions
Products
Tools


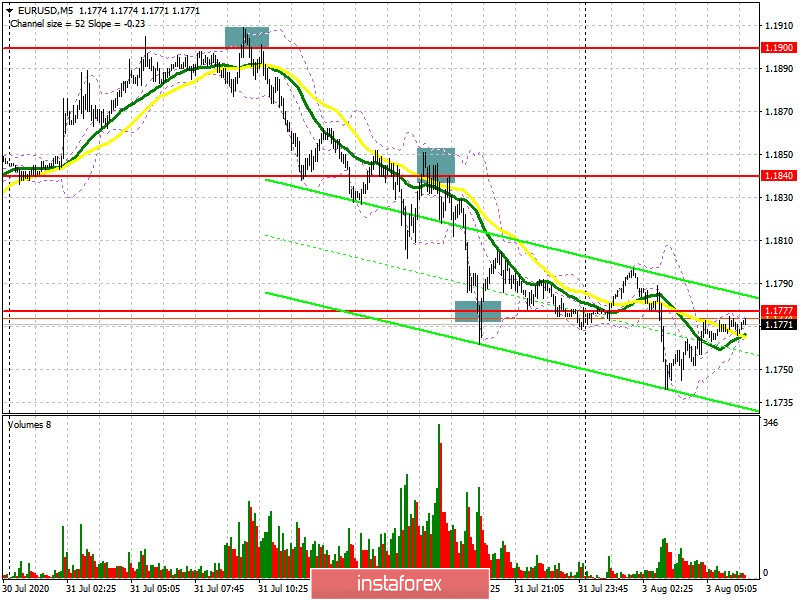
To open long positions on EUR/USD, you need:
Despite the fundamental statistics on the euro area last Friday, several obvious signals to sell the European currency were formed, which we will now talk about in more detail. If you look at the 5-minute chart and remember my forecast, you will see how forming a false breakout after an unsuccessful attempt to break above the resistance of 1.1900 led to a good entry point forming into short positions and EUR/USD falling to the support area of 1.1840. Then after an unsuccessful attempt by the bulls to return to the market and from this level in the second half of the day, another signal formed to open short positions, and only from the 1.1777 area can and should have bought the euro immediately on the rebound. At the moment, the focus is on this range. Most likely, the bulls will be able to repel it in the first half of the day, which will form a signal to buy the euro. However, much will depend on how the reports on manufacturing activity in the eurozone will turn out today. A slower recovery will not allow the bulls to break above the 1.1840 resistance, where I recommend taking profits. If EUR/USD declines further, I advise you to consider buying only after forming a false breakout in the support area of 1.1704, or open long positions immediately for a rebound from the low of 1.1648 based on a correction of 25-30 points within the day.
To open short positions on EUR USD you need:
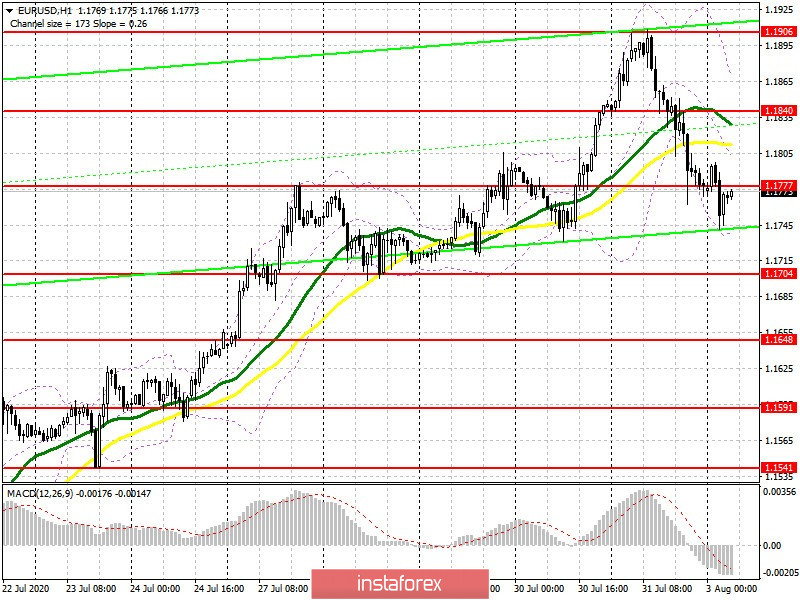
The bears will defend the 1.1777 resistance, but I don't want to bet on it too much. Forming a false breakout in this range after the release of reports on manufacturing activity in the eurozone, will be a signal to sell the euro. The goal of bears in this scenario will be to support 1.1704, where I recommend taking profits. Another target is the low of 1.1648, but we will be able to get to it only with very good indicators of activity in the US. If the pair shows growth in the first half of the day, you can open short positions on a rebound from the resistance of 1.1840, since, in my opinion, there the bears will try to form the upper border of a new descending channel. If there is no activity in this range, it is best to sell EUR/USD only for a rebound from last week's high in the area of 1.1906, based on a correction of 25-30 points within the day.
Indicator signals:
Moving averages
Trading is carried out below 30 and 50 moving averages, which indicates the possibility of continuing the formation of the downward correction.
Note: The period and prices of moving averages are considered by the author on the H1 hourly chart and differs from the general definition of the classic daily moving averages on the daily D1 chart.
Bollinger Bands
Growth will be limited by the upper level of the indicator around 1.1850. A breakout of the lower border of the indicator at 1.1740 will increase pressure on the euro.
Description of indicators
InstaForex analytical reviews will make you fully aware of market trends! Being an InstaForex client, you are provided with a large number of free services for efficient trading.

