 Stay
Stay 
Trading Conditions
Products
Tools


Trend analysis.
In August, a pullback movement downward is possible with the first target at 1.1711 - the support line (black bold line). If this line is broken down, we will continue to the next downside target at 1.1608 - the pullback level of 23.6% (red dotted line).
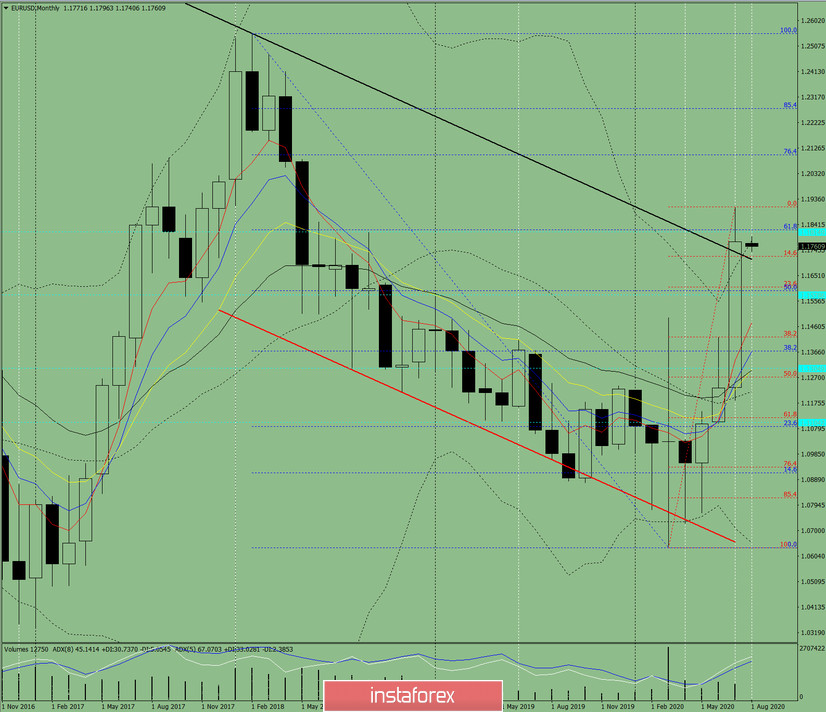
Fig. 1 (monthly chart).
Indicator analysis:
- indicator analysis - down;
- Fibonacci levels - down;
- volumes - down;
- candlestick analysis - down;
- trend analysis - up;
- Bollinger lines - down;
The conclusion on a comprehensive analysis is most likely the bottom job.
The general result of the calculation of the candlestick of the EUR/USD currency pair according to the monthly chart: the price will most likely have a downward trend with the absence of the first upper shadow (the first week of the month is the lower one) in the monthly black candlestick and the presence of the second lower shadow (the last week is white).
General scenario: from the level of 1.1778 (closing of the July monthly candlestick), the lower target at 1.1711 is the support line (black bold line).
If this line breaks down, the next lower target is at 1.1606 - the pullback level of 23.6% (red dashed line).
In the case of a rebound from this line up, the next upper target will be 1.1908 - the upper fractal (red dotted line).
InstaForex analytical reviews will make you fully aware of market trends! Being an InstaForex client, you are provided with a large number of free services for efficient trading.

