 Stay
Stay 
Trading Conditions
Products
Tools


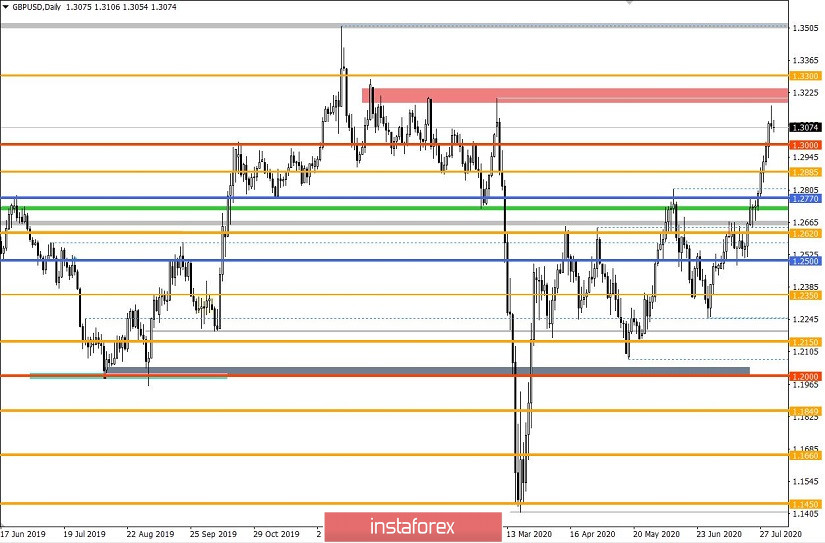
The past trading week passed on a wave of bullish excitement, where the quote managed to change the fluctuation range from 1.2150 // 1.2350 // 1.2620 to 1.2770 // 1.3000 // 1.3300, which indicates significant losses in the dollar's positions in the market. If you analyze for the entire July, you will see that the scale of sales of the US dollar is over 800 points.
A high rate of change in quotes signals a significant degree of oversold in the dollar, as well as an overbought pound sterling, which will lead to a technical correction in the market sooner or later.
Based on the new fluctuation range (1.2770 // 1.3000 // 1.3300), you can see that the quote has already moved to the upper border, where the 1.3200/1.3250 area puts pressure on market participants, thereby repeating the logical basis for the period from January to March 2020.
It turns out that the conditional ceiling may come much earlier than touching the border of 1.3300 and a technical correction will finally appear in the market.
Analyzing the Friday day in detail, you can see a local slowdown within the deviation 1.3200/1.3250, where the quote tried to find a resistance point. If we consider the trading chart in relation to a four-hour period, then the candles from 9:00 and 13:00 UTC+00 can reflect the "bearish absorption" candlestick pattern, which is a reversal pattern in technical analysis.
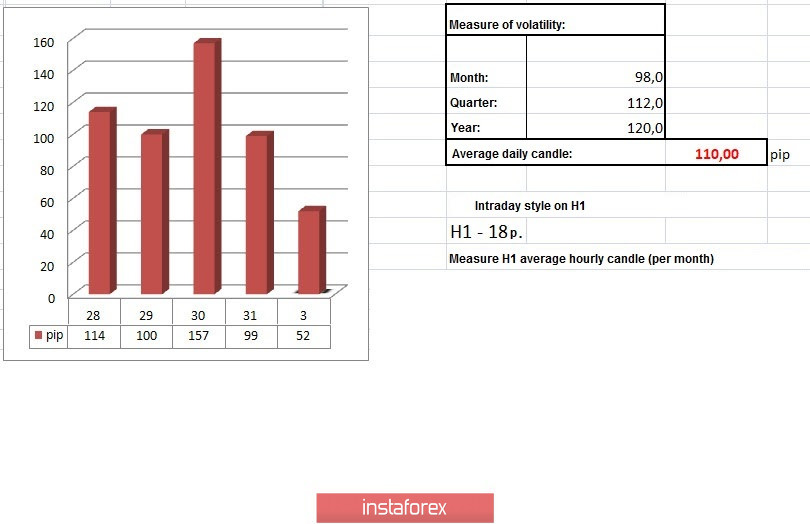
In terms of volatility, we see the indicator slightly below the daily average (110 ---> 99 points), but if we take into account the moment of local slowdown, then the activity is still at a high level.
Analyzing the dynamics of volatility in July, you can see that the average daily indicator is 99 points, which is 22% lower than in June.
JULY : Wednesday - 131 points; Thursday - 73 points; Friday - 48 points; Monday - 54 points; Tuesday - 129 points; Wednesday - 114 points; Thursday - 69 points; Friday - 96 points; Monday - 115 points; Tuesday - 84 points; Wednesday - 98 points; Thursday - 104 points; Friday - 61 points; Monday - 147 points; Tuesday - 117 points; Wednesday - 99 points; Thursday - 86 points; Friday - 86 points; Monday - 122 points; Tuesday - 114 points; Wednesday - 100 points; Thursday - 157 points; Friday - 99 points
The dynamics is 132 points (average daily value) since the beginning of the year, which indicates a high speculative interest in the market.
Looking at the trading chart in general terms (daily period), you can see another candlestick pattern, the so-called "Shooting Star" - 07/31/2020. This candlestick analysis pattern occurs in an upward market and reflects a small body in a downward direction and a large shadow over the body of the candle. If this model is confirmed by other technical analysis tools (linear, graphical, mathematical analysis), then the level of its reliability increases. In this case, confirmation comes from linear analysis in the form of a resistance area 1.2200/1.2250.
The news background on Friday did not have any noteworthy statistics for the UK and the United States, the only thing that was there was data for Europe, but we will analyze them in the article on EUR/USD.
In terms of the information background, we do not have something grand, the media, as before, are conducting a large-scale discussion of key topics: coronavirus, economic crisis, and Brexit.

Today, in terms of the economic calendar, we have a PMI day, where both Europe and the United States will publish the Manufacturing PMI, signaling a recovery. Based on preliminary data, everyone is ready for the growth of the index, which means that it has already been considered in the quote.
UK 8:30 Universal time - Manufacturing PMI (July): Prev. 50.1 ---> Forecast 53.6.
USA 14:00 Universal time - ISM Manufacturing PMI (July): Prev. 52.6 ---> Forecast 53.6.
Further development
Analyzing the current trading chart, you can see a slight pullback in scale, which brought the quote to the area of 1.3060. The current price change is not enough to weaken the overbought status, which means that there is still a chance for the market to move from a pullback to a correction. If we refer to a number of technical signals: candlestick patterns, resistance area, then there is a chance of a more impressive change in the quote in the market.
In terms of the emotional state of the market, as before, speculative activity is recorded, which can lead to an increase in volatility.
We can assume that if the price consolidates below the level of 1.3050, the way will open to us in the direction of values 1.3000-1.2950. A full-scale correction will be considered as the quote's decline to the area of 1.2885-1.2770, which may serve as the formation of a tick in a new range.
An alternative scenario will be considered in the absence of a corrective move and the price consolidating higher than 1.3115, which may well lead us to the values of 1.3200-1.3250.
Based on the above information, we will display trading recommendations:
- Consider sell deals below the level of 1.3050, towards 1.3000-1.2950.
- Consider buy deals above the level of 1.3115, with the prospect of a move to 1.3200-1.3250.
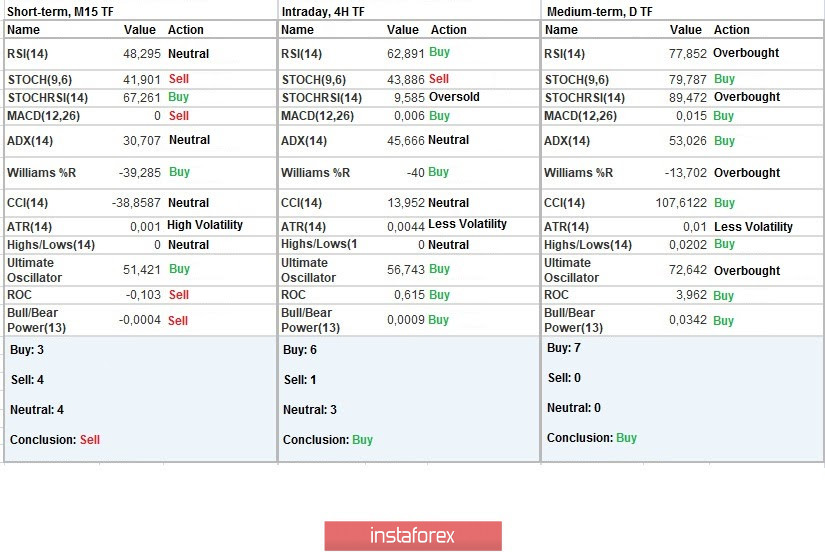
Indicator analysis
Analyzing different sectors of time frames (TF), we see that the indicators of technical instruments on minute intervals signal a sell due to the existing pullback in the market. Meanwhile, hourly and daily intervals reflect an upward inertial movement.
Weekly volatility / Volatility measurement: Month; Quarter; Year
Measurement of volatility reflects the average daily fluctuation, calculated per Month / Quarter / Year.
(3 August was built taking into account the time of publication of the article)
The volatility of the current time is 52 points, which is 52% below the daily average. The transition of the price to the stage of correction can lead to an increase in activity in the market.
Key levels
Resistance zones: 1.3200 **; 1.3300 **; 1.3600; 1.3850; 1.4000 ***; 1.4350 **.
Support zones: 1.3000; 1.2885 *; 1.2770 **; 1.2620; 1.2500; 1.2350 **; 1.2250; 1.2150 **; 1.2000 *** (1.1957); 1.1850; 1.1660; 1.1450 (1.1411); 1.1300; 1.1000; 1.0800; 1.0500; 1.0000.
* Periodic level
** Range level
*** Psychological level
InstaForex analytical reviews will make you fully aware of market trends! Being an InstaForex client, you are provided with a large number of free services for efficient trading.


