 Stay
Stay 
Trading Conditions
Products
Tools


Hello, dear colleagues!
The fundamental background of the last week of July was remembered by the Fed's decision on rates and Jerome Powell's press conference, as well as data on GDP in the Eurozone and the US. These main events of the past week were covered in sufficient detail, so there is no point in going back now. It is much more correct and reasonable to look ahead.
As you know, on every Friday of the new month (with rare exceptions), the most important data on the US labor market for investors are released. This Friday will be no exception, when the United States Department of Employment releases its labor reports for July on August 7. There is no doubt that this will be the main macroeconomic event of the current week. There will be other interesting and quite important data from Europe and the United States, however, we will mention them directly on the day of their release. As for the first day of this trading week, it can not boast of a large volume of statistics. Except that, it is worth noting the index of business activity in the manufacturing sector in Germany and the Eurozone, which will be released at 08:55 and 09:00 London time, respectively. From the US, at 15:00 (London time), we will learn about the Institute for Supply Management's (ISM) manufacturing index.
Well, now it's time to start analyzing the technical picture of the main currency pair of the Forex market. Given that the market closed July last Friday, let's look at the monthly chart of the euro/dollar.
Monthly
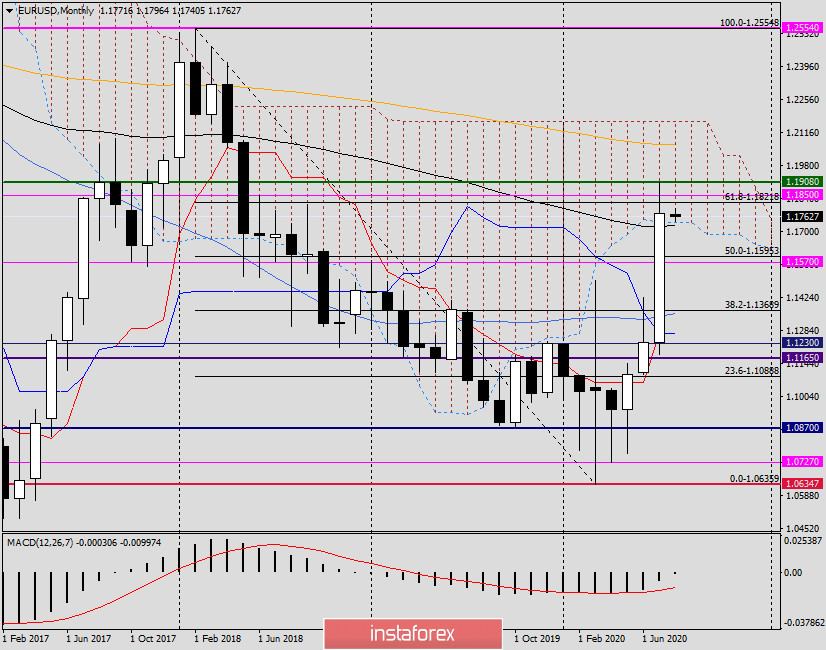
The EUR/USD currency pair finished July trading with an impressive growth and closed last month at 1.1778. Here you should pay attention to several interesting points. July trading ended above the 89 exponential moving average and within the cloud of the Ichimoku indicator, which, of course, can be recognized as the merit of the bulls for this instrument. At the same time, the pair bounced down quite strongly from the maximum values of the previous month, shown at 1.1908, and could not close July above the landmark and important mark of 1.1800. It seems that the strong technical level (pink) 1.1850 played an important role in this.
Now, support can be obtained in the case of a decline to 1.1725, where the broken lower border of the Ichimoku cloud and 89 EMA are located. The task of players to increase will be to keep the quote above the 89 exponential and within the cloud. If the euro bulls manage to rewrite the July highs of 1.1908, the pair will go to conquer the following heights with a high probability: 1.1960, 1.1980, 1.1000, 1.2030 and 1.2060. However, it is not quite correct to make any specific forecasts for a monthly timeframe, so it makes sense to switch to smaller time intervals.
Weekly
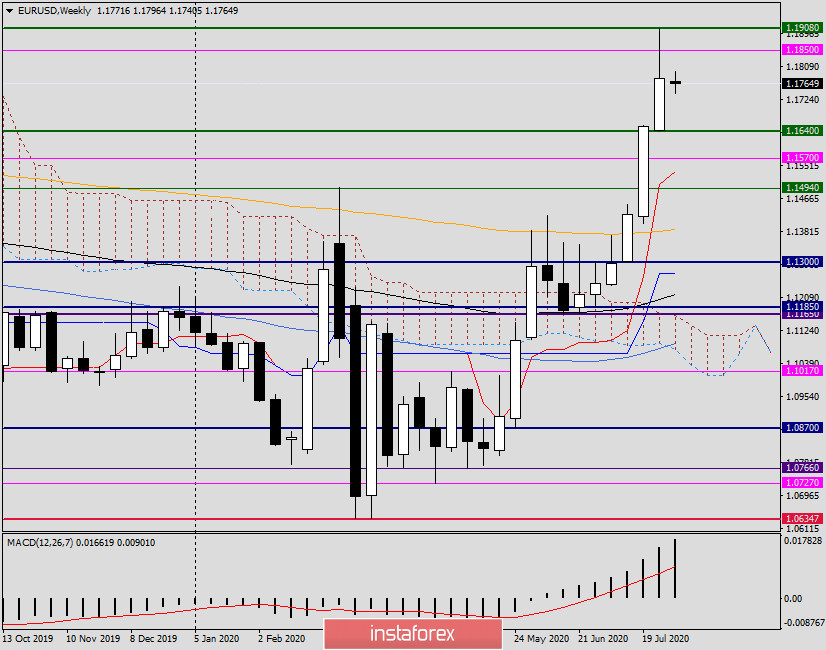
Despite the fact that the week ended for EUR/USD with a growth of 1.05%, the long upper shadow of the last candle, approximately the same size as the bullish body itself, leads to speculation about the ability of the quote to continue rising. In the current situation, you should pay attention to the maximum and minimum values of the last five-day trading period. The breakdown of strong resistance of sellers in the area of 1.1900 will breathe fresh strength into the bulls, and they will continue to rise the rate. If the bears actually came out of hibernation, they will have to prove it by breaking the 1.1640 mark, where the last weekly lows were shown. Often, such long upper shadows signal the end of an upward trend or, at least, the beginning of a correction, which can be quite deep.
Daily
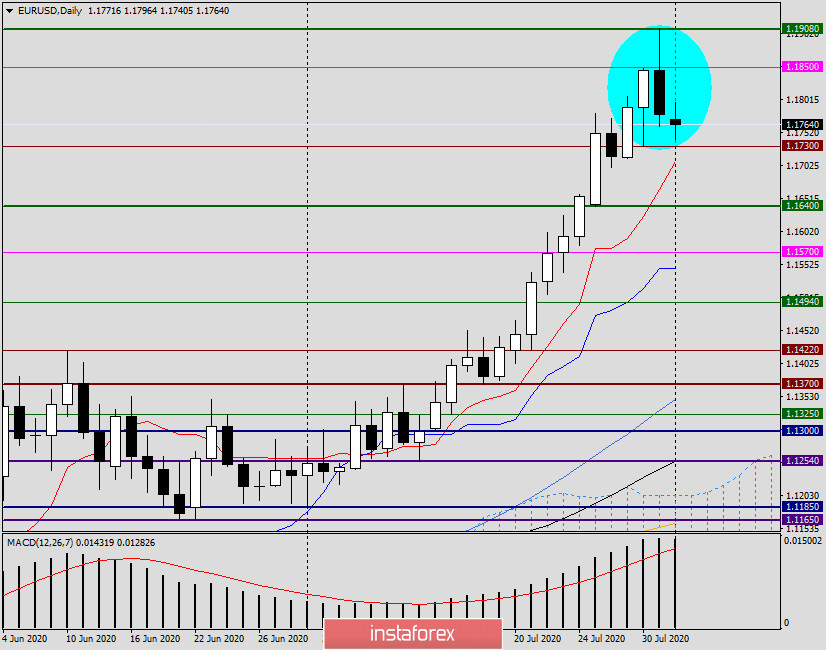
The picture on the daily euro/dollar chart quite specifically signals a high probability of a decline. In particular, this is indicated by the "bearish absorption" candle, which was formed on the last day of July trading.
In order to break this bearish candle signal, the opposing side needs to absorb the candle for July 31 growth. Otherwise, there is a high probability of a reversal of the pair in the south direction. It is difficult to determine whether it will be a course correction or a trend change right here and now. It is necessary to observe the pair's behavior near such levels as 1.1790, 1.1810 and 1.1850. If bearish reversal patterns of candle analysis appear in the immediate vicinity of these marks on the daily, four-hour or hourly charts, this will be a signal for selling the euro/dollar.
Conclusion and recommendations for EUR/USD:
Taking into account the technical picture on the considered timeframes, there is a high probability of course correction, or even a change of the upward trend to a downward trend. However, it is too early to draw conclusions about a change in the trend, however, the downward prospects seem quite real. The piquancy of the situation is added by the fact that the Fed's "dovish" rhetoric and the strongest drop in US GDP in the second quarter and the deplorable situation in the United States with COVID-19 failed to increase pressure on the US currency. It is likely that these factors have already been taken into account in the price of the US dollar. If so, the main trading recommendation, at the moment, is sales, the nearest of which can be tried after the pair rises to the price zone of 1.1790-1.1815. Higher and more profitable prices for opening short positions can be found after the corresponding candle signals appear near 1.1850/60. In tomorrow's review, we will look at smaller timeframes, and perhaps some amendments will be made to these trading recommendations.
Good luck with trading!
InstaForex analytical reviews will make you fully aware of market trends! Being an InstaForex client, you are provided with a large number of free services for efficient trading.


