 Stay
Stay 
Trading Conditions
Products
Tools


The pair traded sideways in an upward trend on Tuesday. However, it did not break through the resistance line 1.3108 (black bold line) and then went down. Today, the price may move upward and once again try to break the resistance line. Economic calendar news for the pound is expected at 08:30 UTC, and for the dollar at 12:15, 14:00, and 14:30 UTC.
Trend analysis (Fig. 1).
The market may resume moving upward from the level of 1.3073 (closing of yesterday's daily candle) with the target at the resistance line 1.3101 (black thick line). In case of breaking through this level, the upwards trend may continue with the next target at the upper fractal 1.3170 (red dotted line). From this level, a downward pullback is possible.
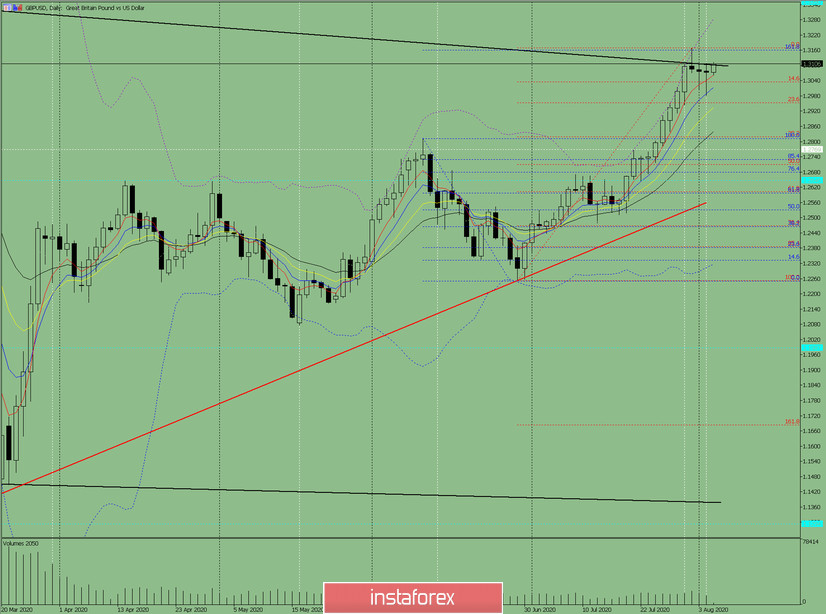
Fig. 1 (daily chart).
Comprehensive analysis:
- Indicator analysis - up;
- Fibonacci levels - up;
- Volumes - up;
- Candlestick analysis - down;
- Trend analysis - down;
- Bollinger lines - up;
- Weekly chart - down.
General conclusion:
Today the price may resume moving upward from the resistance line 1.3101 (black bold line) with the target at the upper fractal 1.3170 (red dashed line). Upon reaching this level, a downward pullback is possible.
Another possible scenario is upon testing the resistance line 1.3101 (black bold line), the price may move downward with the target of 1.3037 - a 14.6% pullback level (red dotted line).
InstaForex analytical reviews will make you fully aware of market trends! Being an InstaForex client, you are provided with a large number of free services for efficient trading.

