 Stay
Stay 
Trading Conditions
Products
Tools


To open long positions on EURUSD, you need:
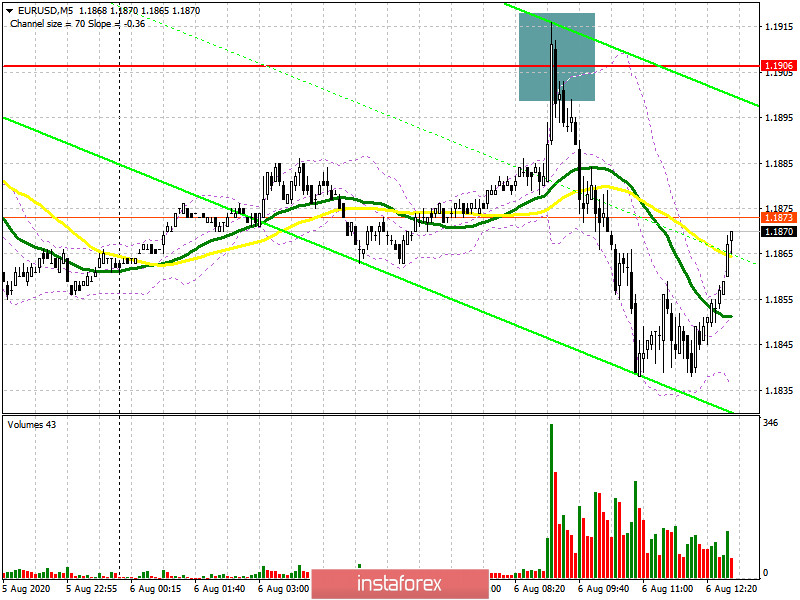
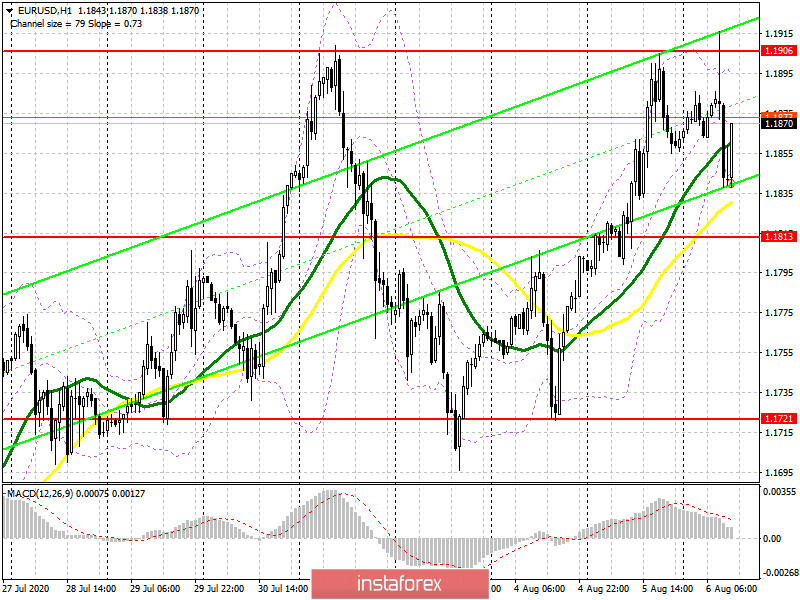
In the first half of the day, I paid attention to the high probability of short positions in the resistance area of 1.1906 and recommended selling the euro from there when forming a false breakout, which happened. If you look at the 5-minute chart, you will see how the bears quickly returned EUR/USD to the level of 1.1906 after an unsuccessful breakout attempt. On the hourly chart, a divergence was also formed on the MACD indicator, which served as an additional signal to open short positions. Since entering the market, the downward movement has been more than 60 points, which is quite good for intraday volatility. At the moment, the goals of buyers have not changed compared to the morning forecast. The key task of the bulls is to break through and consolidate above the range of 1.1906, since only in this case it will be possible to open long positions in the expectation of continuing the bullish trend to the highs of 1.1987 and 1.2020, where I recommend fixing the profits. The area of 1.2054 will be a more distant target. However, the optimal scenario is to buy EUR/USD after a downward correction to the support area of 1.1813, where the pair is currently aiming. There you can open long positions immediately on the rebound in the expectation of an upward movement of 30-40 points. If there is no bull activity at this level, the next major support will be the minimum of 1.1721, which is also the lower limit of the current wide side channel.
To open short positions on EURUSD, you need:
Sellers in the morning acted with special precision and took advantage of the growth of the euro in the resistance area of 1.1906, once again protecting it beautifully. The nearest target for short positions is the middle of the side channel 1.1813, where the pair is currently aiming. A breakout and consolidation below this range will lead to a larger decline in EUR/USD in the afternoon to the area of the minimum of 1.1721, where I recommend fixing the profits. However, you can expect such a powerful fall in the euro only after the release of sufficiently bad data on the state of the US labor market, which will scare off buyers of risky assets. If the euro rises in the second half of the day, you can sell at the next formation of a false breakout in the area of 1.1906 or from new local highs in the area of 1.1987, counting on a correction of 30-40 points within the day.
Signals of indicators:
Moving averages
Trading is conducted in the area of 30 and 50 daily moving averages, which indicates another attempt by bears to take the market under their control.
Note: The period and prices of moving averages are considered by the author on the hourly chart H1 and differ from the general definition of the classic daily moving averages on the daily chart D1.
Bollinger Bands
Breaking the upper limit of the indicator around 1.1900 will lead to a new wave of euro growth. A break in the lower border of the indicator at 1.1835 will increase pressure on the euro.
Description of indicators
InstaForex analytical reviews will make you fully aware of market trends! Being an InstaForex client, you are provided with a large number of free services for efficient trading.


