 Stay
Stay 
Trading Conditions
Products
Tools


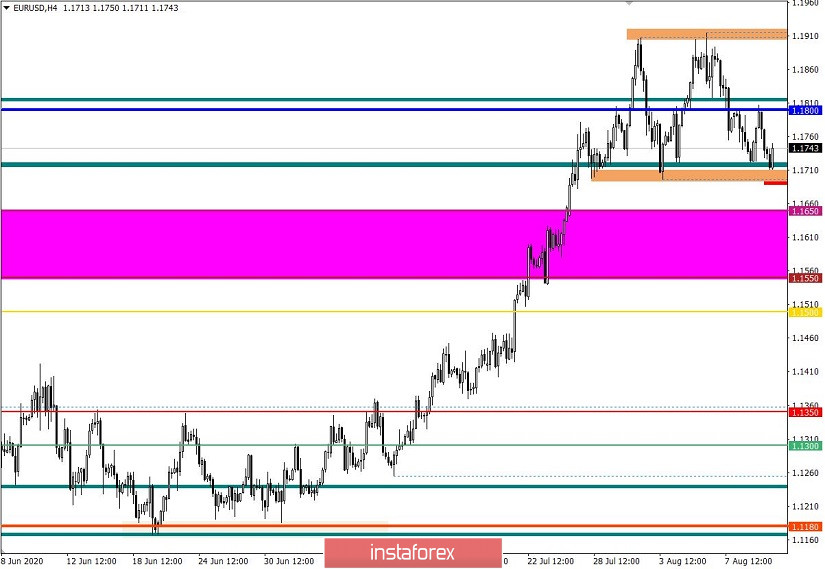
The EUR/USD currency pair, following a downward course from the resistance area of 1.1910, reached the support area of 1.1700/1.1720, where a rebound appeared on a regular basis, but it did not lead to drastic changes, and the quote continued to concentrate within the pivot point.
Based on the general dynamics, it was revealed that the market completed the inertial upward move, which took place in July, and was replaced by a temporary flat 1.1700/1.1910, within which the quote is developing. It is likely that the sideways movement is a temporary haven for speculators, which can play into the hands of the upcoming acceleration, and if we refer to the oversoldness of the US dollar, the chance of a downward development is high.
Analyzing the last trading day by the minute, you can see an inverted V-shaped formation, where the quote has a course of 1.1720 ---> 1.1800 ---> 1.1720. The formation is considered complete and downward trend interest prevails in the market.
In terms of daily dynamics, an acceleration is recorded relative to Monday (August 10) by 28%, which was considered an expected phenomenon due to the abnormally sharp decline in activity.
It is worth considering that with the onset of the sideways movement, the market dynamics began to decline, but speculators are still active, and in the event of a breakdown of one or another room of the range, a new round of volatility will arise.
As discussed in the previous review, traders did not exclude a local rebound from the area of 1.1700/1.1720, in the direction of 1.1800, while the border breakout tactics are still relevant.
Looking at the trading chart in general terms (daily period), you can see a clear stop after inertia, where the "Double Top" chart pattern has appeared, which signals a possible market reversal. This chart pattern was previously fixed on a four-hour (H4) period.
The news background of the past day included the PPI in the United States, where they recorded an acceleration of 0.6% in July (m/m) against the forecast of growth of 0.3%. In annual terms, the decline was -0.4%, while the forecast was -0.7%.
The news was good for the oversold dollar. There was a strengthening of the rate almost immediately after the publication of statistics.
In terms of the information background, as before, they are discussing the coronavirus crisis, where one media predicts a bright future, while others predict a worsening of the situation in the fall. FFrom the new or long-forgotten old, there was a noise about a trade deal between the US and China, where it turns out that all the negativity that resulted during the peak of the coronavirus and the war of consulates did not affect the relationship in any way. According to white house chief economic adviser Larry Kudlow, relations between the countries are excellent, and Beijing continues to buy American goods, in particular commodities, as part of its "phase 1" trade deal with the United States.
There is no discussion of the second phase of the transaction yet, but considering the new data, it is clear that the disputes and dissatisfaction of the parties do not prevent them from trading and fulfilling the obligations of the first phase of the transaction.
Today, in terms of the economic calendar, one of the most important events of the week is the publication of inflation data in the United States. According to the most conservative forecasts, inflation should rise from 0.6% to 0.7%, indirect macroeconomic data indicate that it may rise to 0.8%. In the current environment, the growth of inflation is perceived as an extremely positive factor, thus, the US dollar may move to strengthening, if expectations coincide.
Further development
Analyzing the current trading chart, you can see another touch of the 1.1700/1.1720 area, where the price rebounded towards 1.1745 on a regular basis. Now, a lot will depend on the news background, since in case of confirmation of the optimistic data on US inflation, the current price rebound will quickly change to a downward trend, where the lower border of the 1.1700 / 1.1910 side range will be hit.
In terms of the emotional state of the market, we can see that although speculators have reduced their activity, they still continue to work on local jumps, where, if the boundaries of a flat are overcome, an acceleration will occur.
As the main strategy, the method of detecting the breakdown of the established boundaries of the 1.1700/1.1910 flat is used, where, based on the oversold dollar and positive expectations for inflation, there is a high chance of downward development towards 1.1650-1.1600-1.1550.
An alternative scenario considers holding the quote along the course of the flat range 1.1700/1.1910.
Based on the above information, we will display trading recommendations:
- Consider sell deals below 1.1810 towards 1.1900
- Consider buy deals below 1.1690, towards 1.1650-1.1600.
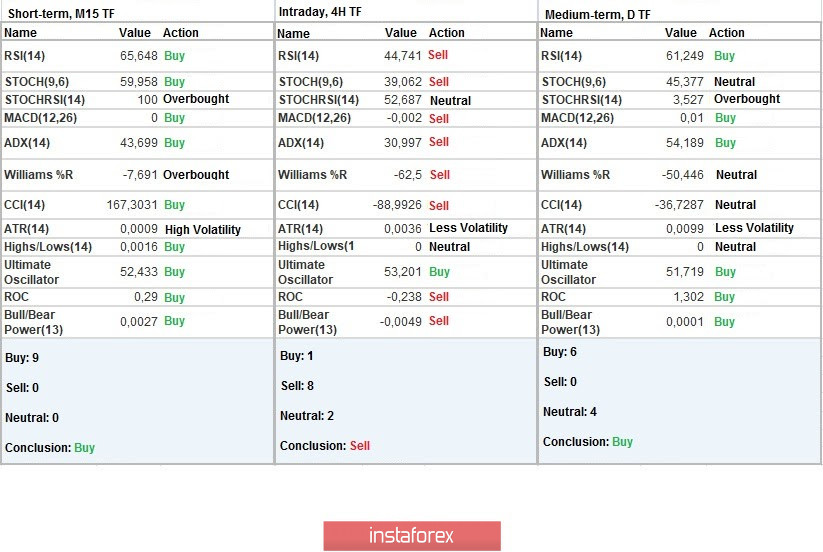
Indicator analysis
Analyzing different sectors of time frames (TF), we see that the indicators of technical instruments on minute intervals signal a buy due to a price rebound from the flat border. Meanwhile, hourly periods signal a sell by finding prices below the level of 1.1800.
The daily period, as before, signals a buy, but if the price consolidates below 1.1690, everything can change.
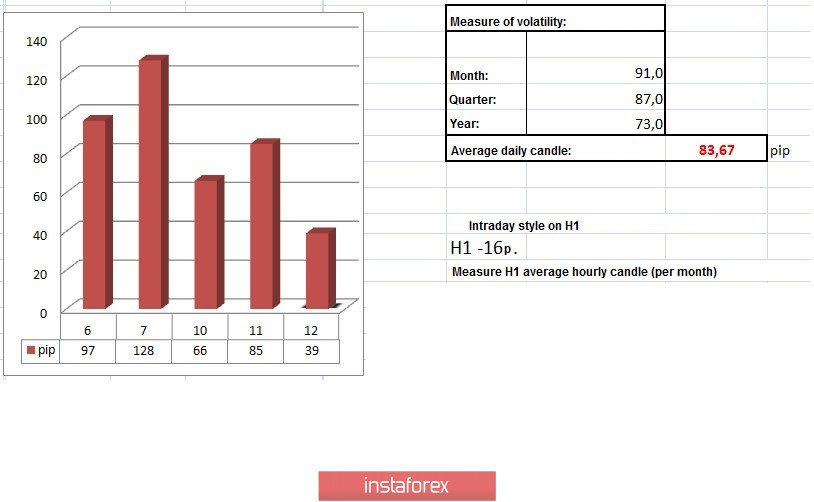
Weekly volatility / Volatility measurement: Month; Quarter; Year
Measurement of volatility reflects the average daily fluctuation, calculated per Month / Quarter / Year.
(12 August was built taking into account the time of publication of the article)
The current time volatility is 33 points, which is 53% lower than the daily average. Market activity will continue to grow due to the news background, as well as the speculative mood of the market.
Key levels
Resistance zones: 1.1800 **; 1.1900 *; 1.2000 ***; 1.2100 *; 1.2450 **.
Support zones: 1.1650 *; 1.1500; 1.1350; 1.1250 *; 1.1.180 **; 1.1080; 1.1000 ***; 1.0850 **; 1.0775 *; 1.0650 (1.0636); 1.0500 ***; 1.0350 **; 1.0000 ***.
* Periodic level
** Range level
*** Psychological level
InstaForex analytical reviews will make you fully aware of market trends! Being an InstaForex client, you are provided with a large number of free services for efficient trading.


