 Stay
Stay 
Trading Conditions
Products
Tools


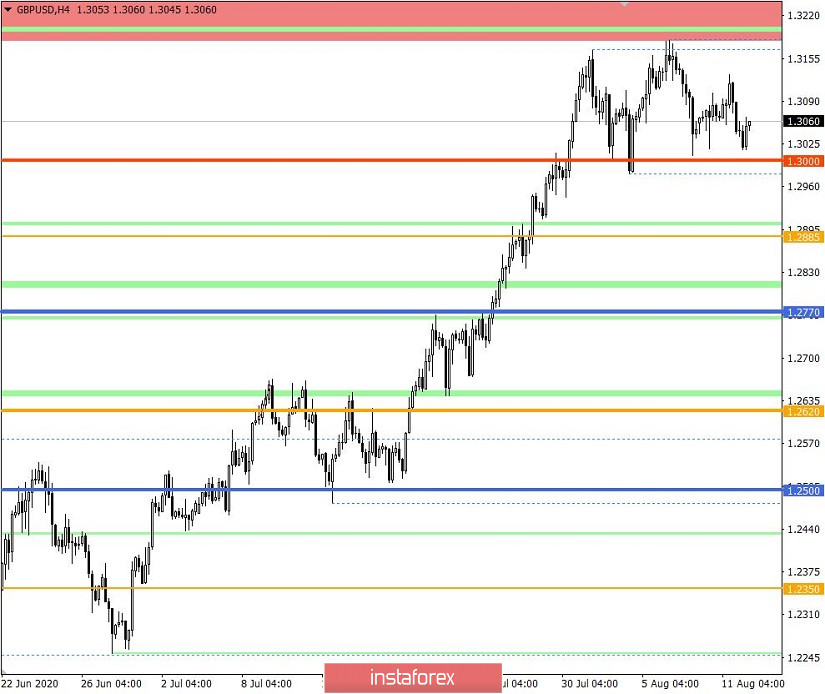
The GBP / USD pair has once again returned to the psychological level of 1.3000, where, on a natural basis, there was a slowdown and, as a result, the price rolled back in the opposite direction.
With all the activity that occurred, the dynamics of fluctuations converged in the sideways movement of 1.2985 / 1.3185, which arose not so long ago, but managed to focus on itself the special attention among traders. Everyone understands perfectly well that a flat is a variable component in the medium-term price fluctuation, but it can serve as a catalyst for trading forces, for which everyone is preparing.
So, if we proceed from the fact that the US dollar is oversold, we can assume that the existing flat will soon enter the phase of a downward move, towards the levels 1.2900 - 1.2885 - 1.2770. However, some traders, referring to the dynamics of fluctuations at the beginning of the year, believe that the flat may drag on for a longer period, expanding the amplitude from 1.2985 / 1.3185 to 1.2958 / 1.3250, since such has already happened in earlier.
Nonetheless, analyzing the past trading day by minutes, we can see that the main turn of short positions fell on the period of the American session, dropping to the low of 1.3041.
Such activity gave volatility below the average daily value, from 111 points to 89 points, which indicates a slowdown. However, if we consider the situation of the flat, a level of 89 points is by no means small and is considered a local acceleration within the amplitude.
Meanwhile, as discussed in the previous review , traders prioritized working on a descent and breakout of the lower limit of the flat, but the process was delayed so the positions with small volumes were held.
So, in the daily chart, the candle still does not have a clear direction, which signals stagnation. At the same time, there is a high level of tension, expressed in relatively small bodies and high shadows of the existing candles (07.31-12.08).

The news published yesterday included data on the UK labor market, which revealed that unemployment rate came out 3.9% for the third month in a row, despite the country recording the largest quarterly increase in unemployment in 11 years. In addition, tax data for July showed that employed people in UK enterprises fell by 730,000 since March, which raises concerns about a potentially much larger rise in unemployment.
The current unemployment rate also raises doubts and questions about the reliability of the information provided by the office for national statistics.
As for the UK GDP, data for the second quarter was published today, which showed a contraction from -1.7% to -21.7%, indicating that the economy is under a recession.
At the same time, data on industrial production also came out, but it showed a slow down in decline from -20.0% to -12.5%, which is better than the expected -14.0. Nonetheless, the UK economy is still under a very bad situation, especially on a medium to long term basis.
Meanwhile in the United States, data on inflation will be released today in the afternoon, the forecast for which is a rise from 0.6% to 0.7%, while indirect macroeconomic data indicate that it may rise to 0.8%. Such is perceived as an extremely positive factor, so the US dollar may rise in the market, especially if real data coincide or surpass the expected figures.
Further development
Analyzing the current trading chart, we can see that activity jumped at the start of the European session, during which the quote once again bounced off the area of the psychological level of 1.3000. Until market participants manage to consolidate the price lower than 1.2985, the sideways movement of 1.3000 / 1.3185 will be relevant, as well as subsequent price rebounds relative to the established boundaries.
Nonetheless, it is assumed that the upcoming data on US inflation will support the dollar, due to which traders will concentrate on short positions, which in theory may lead to a breakout in the lower limit of the flat.
Thus, based on the above information, we present these trading recommendations:
- Sell positions below the price level of 1.2985, targeting a drop towards the levels 1.2900-1.2885.
- Buy positions above the level of 1.3075, targeting a rise towards the price level of 1.3100.
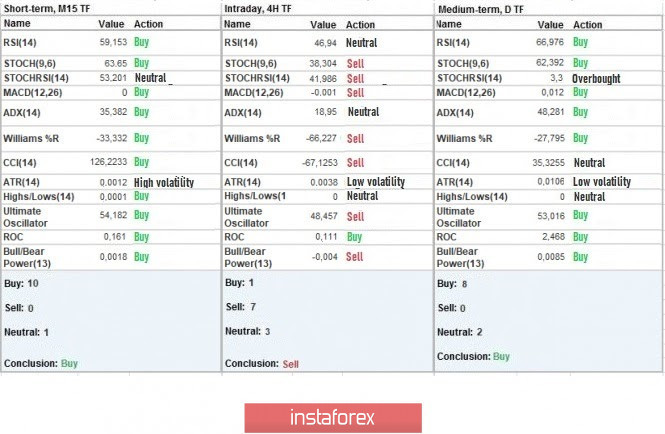
Indicator analysis
Analyzing the different sectors of time frames (TF), we can see that the indicators on the minute period signal "buy" due to a burst of long positions in the morning, while the indicators on the hourly period signal "sell" due to the consolidation of quotes near the price level of 1.3050. As for the daily period, the signal remains "buy" as before, mainly due to the general dynamics of the trend. However, if the quote consolidates below the price level of 1.29585, everything may change and turn downward.
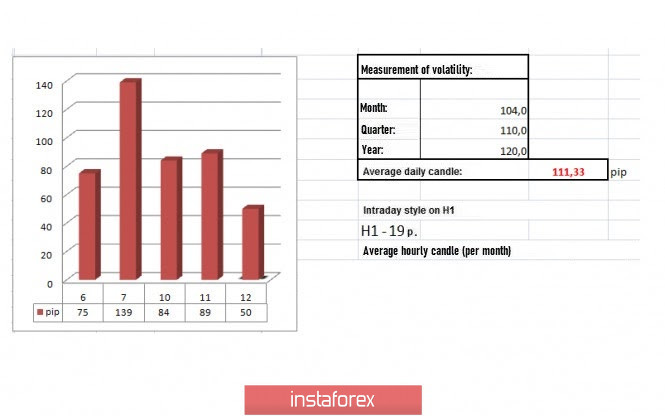
Weekly volatility / Volatility measurement: Month; Quarter; Year
The measurement of volatility reflects the average daily fluctuation, calculated per Month / Quarter / Year.
(August 12's was built, taking into account the time this article is published)
Volatility is currently 50 points, which is 54% below the average daily value. But due to the upcoming news, the dynamics may increase, and may push volatility to its average level.
Key levels
Resistance zones: 1.3200 (1.3250) **; 1.3300 **; 1.3600; 1.3850; 1.4000 ***; 1.4350 **.
Support Zones: 1.3000; 1.2885 *; 1.2770 **; 1.2620; 1.2500; 1.2350 **; 1.2250; 1.2150 **; 1.2000 *** (1.1957); 1.1850; 1.1660; 1.1450 (1.1411); 1.1300; 1.1000; 1.0800; 1.0500; 1.0000.
* Periodic level
** Range level
*** Psychological level
Also check the trading recommendations for the EUR / USD pair here , or the brief trading recommendations for the EUR / USD and GBP / USD pairs here .
InstaForex analytical reviews will make you fully aware of market trends! Being an InstaForex client, you are provided with a large number of free services for efficient trading.


