 Stay
Stay 
Trading Conditions
Products
Tools


The COT report published last Friday showed that gold futures diverged in price, reaching historic highs, with which the Open Interest indicators are 100,000 contracts below the levels reached this spring. Among other things, speculators, who are the main driving force behind the growth of gold and other commodity assets, for seven weeks, maintained long positions at constant values, in the range of 210-220 thousand contracts, which was a fundamental discrepancy. Hence, the market turned out to be overheated, in which a price drop is not long in coming.
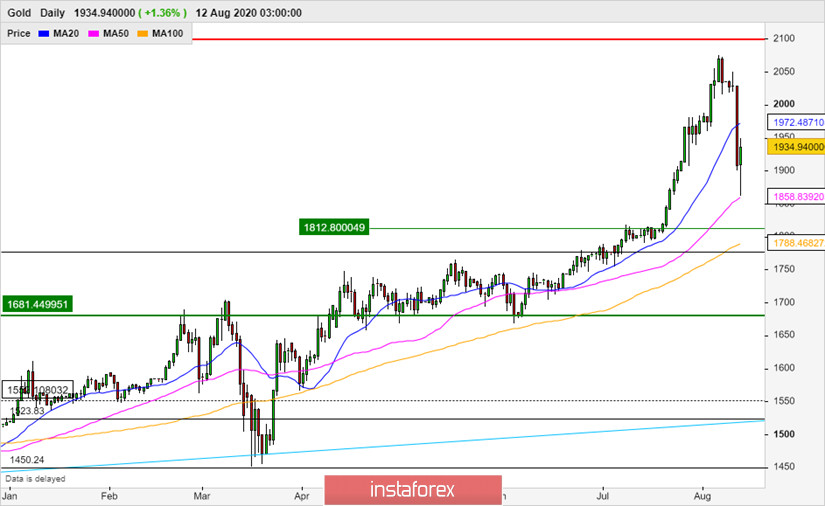
Figure 1: Technical picture of gold, Daily TF
Looking at the daily chart, it is clear that the fall in gold is still a correction, in which the quote crossed the 20 MA (moving average line) from top to bottom and stopped at $ 1860, where the 50 MA is located. In other words, gold fell below the average monthly value, but remained above the average quarterly price level (Figure 1). This suggests that the quote changed direction from up to down in the four-hour timeframe, but remained in an upward direction in the daily TF.
Nonetheless, traders base their transactions depending on which time frame he will enter the market. If it is on the daily TF, buy deals are the most recommended, but before doing this, it is necessary to determine the target level and profit/loss ratio of each transaction in order to avoid significant damage to the deposit.
Thus, looking at the chart again, it is clear that the level which traders should close their position is $ 1788, the price level below the midline of the 100 MA. This is because the 100 MA shows the direction of the trend over the previous six months, with which if the price falls below this value, it will most likely mean that the trend has finally changed its direction from upward to downward, where buy deals are then unprofitable.
As for the approximate target level, it can be calculated by the difference between the current price and the level of the expected stop order: $ 1935 - $ 1788 = $ 147, which can be rounded off to 150. General rules assume a profit and risk ratio of at least 2 to 1, due to which winning trade must close two losing ones. Thus, the target profit is now $ 300, which for our example would be $ 2235.
Meanwhile, if trades are set in lower time frames, positions should be reduced by half from the normal value. Risks should also always be controlled, as to avoid losing profit.
Good luck and have a good day!
InstaForex analytical reviews will make you fully aware of market trends! Being an InstaForex client, you are provided with a large number of free services for efficient trading.


