 Stay
Stay 
Trading Conditions
Products
Tools


Trend analysis (Fig. 1).
The market may move downward from the level of 1.1816 (closing of yesterday's daily candle) with the target of 1.1741 - a 23.6% pullback level (red dotted line). From this level, the downward trend may continue with the next target of 1.1631 - a 38.2% pullback level (red dotted line).
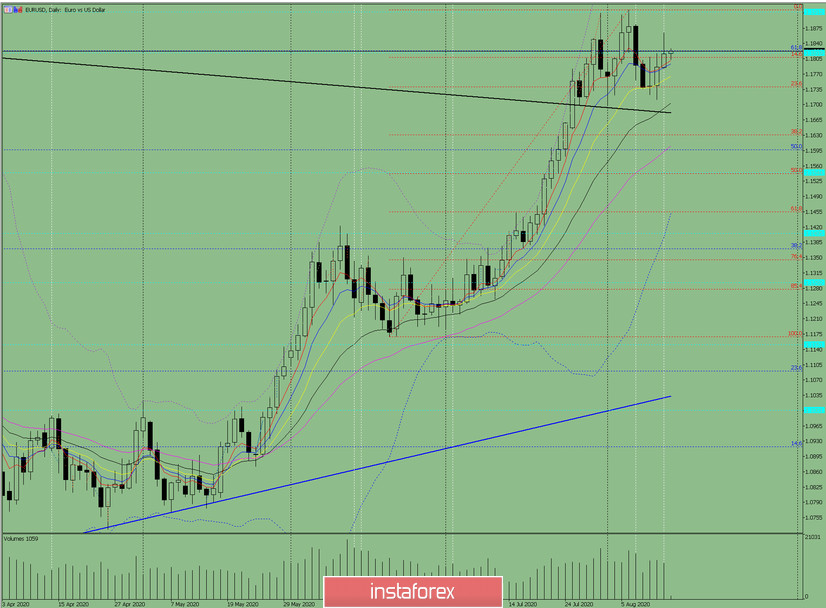
Fig. 1 (daily chart).
Comprehensive analysis:
- Indicator analysis - down;
- Fibonacci levels - down;
- Volumes - down;
- Candlestick analysis - down;
- Trend analysis - down;
- Bollinger lines - down;
- Weekly chart - down.
General conclusion:
Today the price may move downward with the target of 1.1741 - a 23.6% pullback level (red dotted line). From this level, the downward trend may continue with the next target of 1.1631 - a 38.2% pullback level (red dotted line).
Another possible scenario is from the historical resistance level of 1.1819 (blue dotted line), the price may move upward to the upper fractal 1.1865. In case of breaking this level, the upward movement will continue with the next target at the upper fractal 1.1917 (red dotted line).
InstaForex analytical reviews will make you fully aware of market trends! Being an InstaForex client, you are provided with a large number of free services for efficient trading.

