 Stay
Stay 
Trading Conditions
Products
Tools


The EUR / USD pair has been following the trajectory of the flat since Thursday last week, with which market participants failed to change the current trend.
The sideways channel continues to develop, and sooner or later, speculators will proceed to take advantage of the situation, which will lead to a local surge in activity and breakout from the established boundaries.
But until this situation arises in the market, the scale of the side channel will be enough for optimal trading deals.
Thus, if we analyze the trading last Friday by minutes, we can see that the round of long positions appeared from 10:30 to the end of the day, during which the quote managed to reach the price level of 1.1850. Afterwards, a rebound from 1.1800 occurred, and the price turned down in the market.
Such gave a slight deceleration of volatility by 20%, which is considered a normal deviation when the price moves in a sideways channel.
It followed the idea in the previous review , where traders used optimal tactics, with which local positions with smaller volume were opened within the channel, and the main volume was kept within the flat, working on their breakout.
So, in the daily chart, a fluctuation within the high of the previous movement can be seen, and there are signals that a "Triple Top" may form in the chart in the near future.
As for news, data on EU GDP for the second quarter was published last Friday, where it was revealed that the economic downturn was at -15.0%, indicating a disaster for the EU economy. However, the market was already ready for such figures, so there was no significant reaction with regards to trading.
In the afternoon, data on retail sales in the United States was published, and, according to the report, sales in July were 1.2% against expectations of 1.9%, which affected the US dollar in terms of its further weakening. On the positive side, the previous data for June was revised for the better from 7.5% to 8.4%, but this did not help the dollar in any way.
A little later, data on US industrial production was published, where it was reported that instead of a 3.0% growth in July, the indicator jumped 3.4%. Unfortunately, this factor also did not change the current situation of the dollar.
Today, interesting statistics for Europe and the United States will be released, and the market will continue to follow the technical fluctuation.
Further development
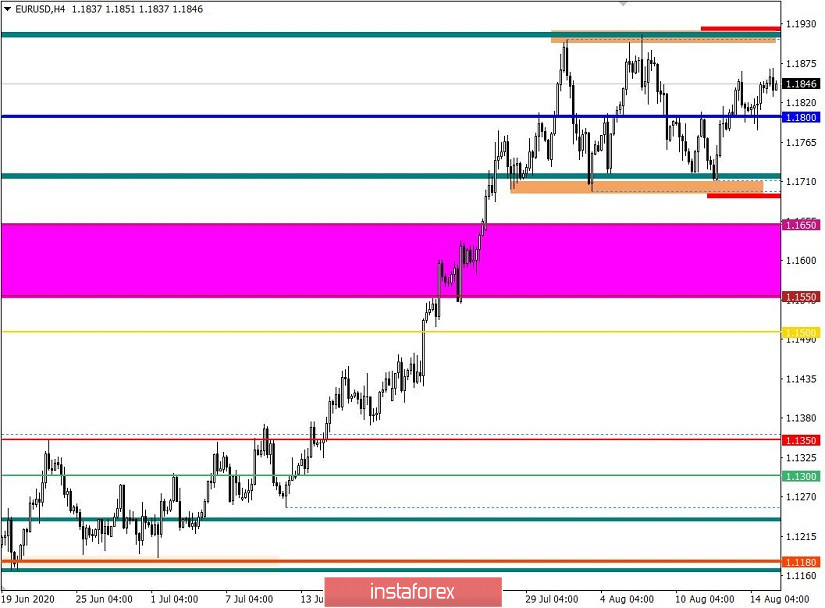
Analyzing the current trading chart, we can see that the quote passed above the level of 1.1800, and came close to the local high reached on August 13.
If the price consolidates even higher, perhaps above the level of 1.1870, the quote will rise and may even reach the upper border limit of the flat, which is the level of 1.1910. But, an alternative scenario could develop, if the price consolidates below 1.1790, transiting into a fluctuation around 1.1700 to 1.1800.
Indicator analysis
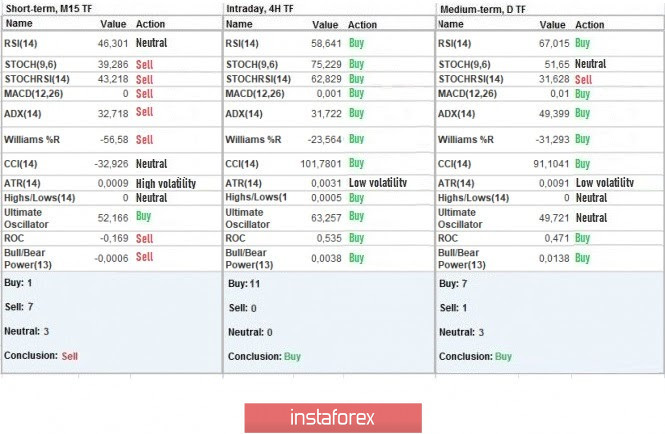
Analyzing the different sectors of time frames (TF), we can see that the indicators on the hourly period signal buy, mainly due to the consolidation of quotes above the level of 1.1800. Meanwhile, the daily period is still at a buy signal, reflecting the general direction of the trend.
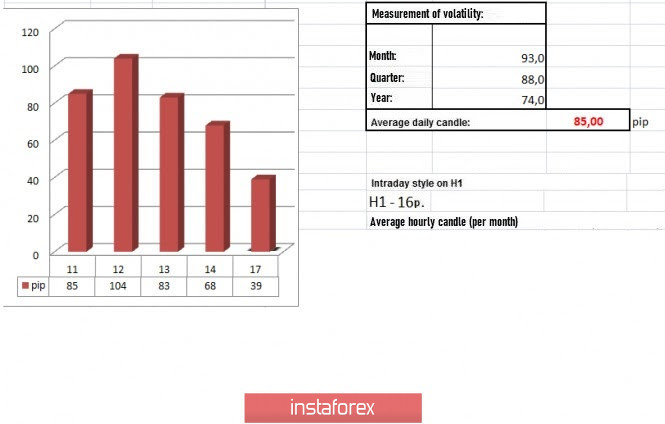
Weekly volatility / Volatility measurement: Month; Quarter; Year
Measurement of volatility reflects the average daily fluctuation, calculated per Month / Quarter / Year.
(August 17's was built, taking into account the time this article is published)
Volatility is currently 39 points, which is 54% below the average daily value. This suggests that the dynamics are at a low level, with which a 50% acceleration relative to the value of 39 pips is not excluded.
Key levels
Resistance zones: 1.1900 **; 1.2000 ***; 1.2100 *; 1.2450 **.
Support Zones: 1.1800; 1.1650 *; 1,1500; 1.1350; 1.1250 *; 1.1180 **; 1.1080; 1.1000 ***; 1.0850 **; 1.0775 *; 1.0650 (1.0636); 1.0500 ***; 1.0350 **; 1.0000 ***.
* Periodic level
** Range level
*** Psychological level
Also check the trading recommendations for the GBP / USD pair here , or the brief trading recommendations for the EUR / USD and GBP / USD pairs here .
InstaForex analytical reviews will make you fully aware of market trends! Being an InstaForex client, you are provided with a large number of free services for efficient trading.


