 Stay
Stay 
Trading Conditions
Products
Tools


Yesterday's publication of the minutes of the last meeting of the US Federal Reserve System (FRS) became an occasion for strengthening the US currency against the British pound. Nothing radically new or unexpected was reflected in the protocols. You can learn more about this by reading today's EUR/USD review. In order not to repeat myself, I will immediately proceed to the technical picture and trading recommendations for the GBP/USD currency pair.
Daily
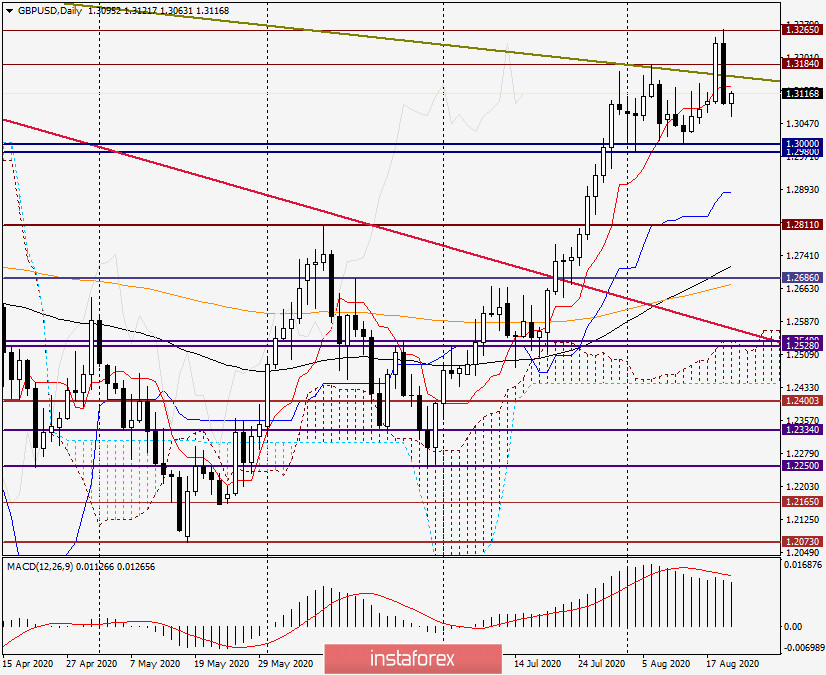
As a result of a strong decline, yesterday's trading closed under the Tenkan line of the Ichimoku indicator, which is not good for continuing the upward scenario. Moreover, the pair's attempts to break through the resistance line of the long-term downward trend of 1.5817-1.3184 were doomed to failure. However, it will be possible to judge this only after the end of the current weekly trading.
At the time of writing this article, the pound/dollar pair is trying to make a correction to yesterday's fall, but so far it is not very successful for the bulls on the pound. If the rise resumes, the nearest resistance may be met in the area of 1.3135-1.3155, where the broken line Tenkan is located yesterday, as well as the already mentioned resistance line 1.5817-1.3184. If players on the course upgrade manage to move higher, the goals will be 1.3184 and 1.3200. At the same time, it should be noted that, at the moment, the key resistance of sellers passes at 1.3265. That until this level is broken and the quote is not fixed higher, it does not make sense to talk about further growth of GBP/USD and determine the next goals at the top. A very strong rebound from 1.3265 shows the strength of this mark and puts the bulls on the instrument in a rather difficult position.
If the bears do not miss the moment and continue the pressure, the pair risks falling into the key support area of 1.3000-1.2980. The chart clearly shows the strength and significance of this price zone, which has already several times restrained the attempts of players to lower the price by a foot lower.
H4
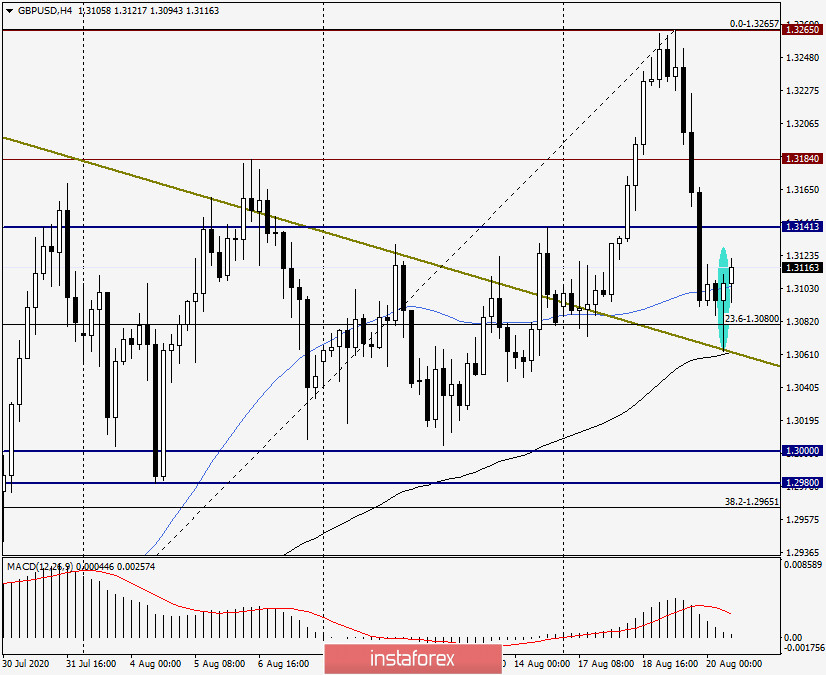
This chart clearly shows that the pair found strong support at the long-term resistance line 1.5817-1.3184, 89 exponential moving average, and also near the 23.6 Fibo level on the Fibonacci grid, stretched to the growth of 1.2478-1.3265. This technical picture is more like a corrective pullback.
After the appearance of a circled candle, which can be considered a reversal with good reason, there is a high probability of continuing the rise to the falsely broken resistance level of 1.3184. If the sterling bulls manage to finish today's trading above this level, we can count on a retest of 1.3265 resistance. Although, we should assume that the 1.3184 mark will try to resist attempts to grow and not let the pair go higher in this situation. If a reversal pattern or a Japanese candlestick pattern appears below this level, this will be a signal to open short positions for GBP/USD.
H1
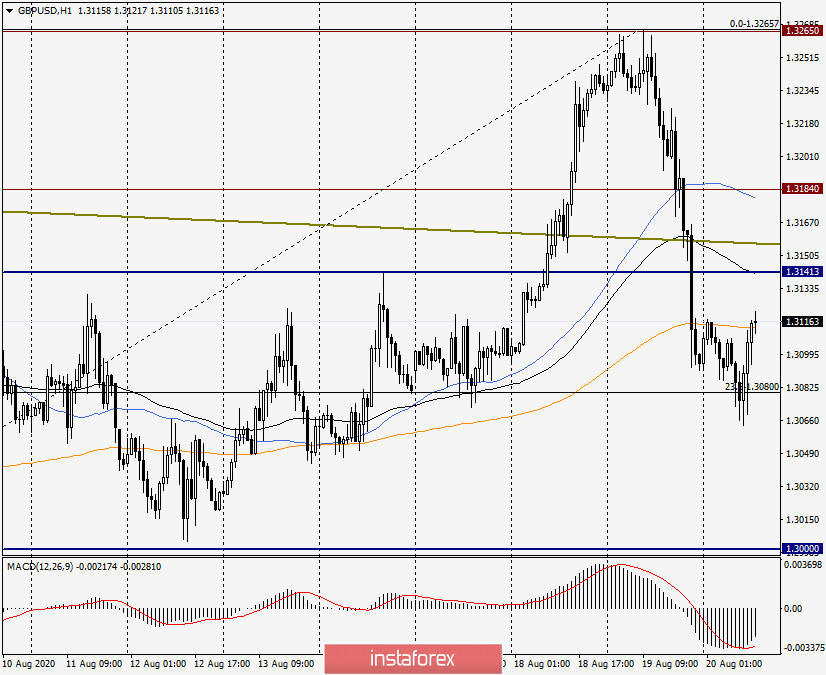
On the hourly chart, the pair tries to return above 200 exponential moving average, which provides the price with quite strong resistance. If you do this, the next target at the top will be a falsely broken resistance level of 1.3141, where the 89 exponential moving average is located. I believe that if the pair can get to 1.3141 and 89 EMA, it will meet strong resistance here and may turn to decline.
At the moment, it is worth considering both options for positioning on GBP/USD, but sales from 1.3140 and 1.3180, technically, look more competent and reasonable. As for purchases, their aggressive and risky can be tried from the current prices. It is less risky to wait for the true breakdown of the 200 EMA and buy a pair with small goals in the area of 1.3140-1.3180 on the pullback to this exponent.
InstaForex analytical reviews will make you fully aware of market trends! Being an InstaForex client, you are provided with a large number of free services for efficient trading.

