 Stay
Stay 
Trading Conditions
Products
Tools


To open long positions on EURUSD, you need:
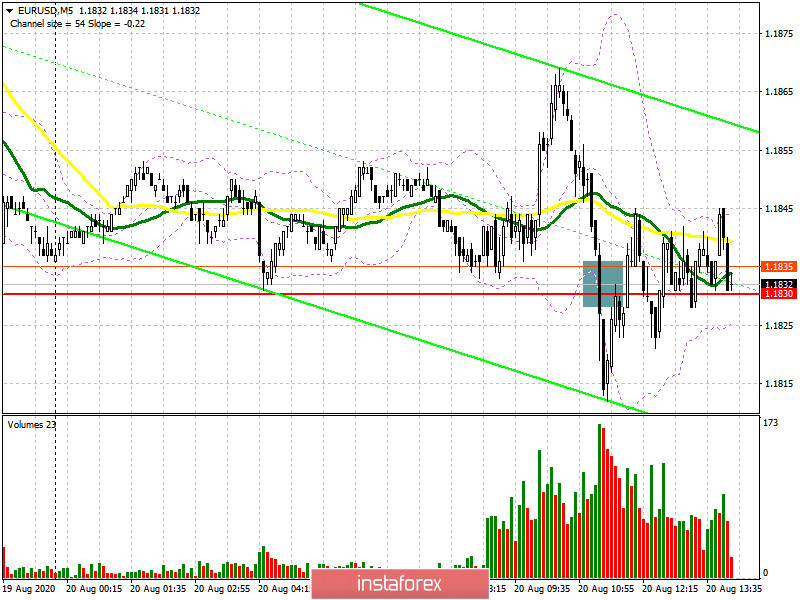
In my morning review, I paid attention to the high probability of protection of the support level of 1.1830, which happened. If you look at the 5-minute chart, you will see how the bears seem to have coped with their task and achieved a breakout and consolidation below the support of 1.1830, but even the test of this level from the bottom up, which became a good entry point into short positions, did not lead to a continuation of the downward correction. The formation of a false breakout at the level of 1.1830 has become a new entry point into long positions, and as long as the market remains above this range, there is a probability of an upward trend in the euro to the resistance area of 1.1884, where I recommend fixing the profits. The longer-term goal will be a maximum of 1.1920. If the bulls again miss the area of 1.1830, and this will most likely happen during the publication of data on the number of initial applications for unemployment benefits in the US, then it is best to consider new long positions from the support of 1.1784 or buy the euro immediately on the rebound from the minimum of 1.1746 in the calculation of a correction of 30-40 points within the day.
To open short positions on EURUSD, you need:
In the second half of the day, sellers will probably try to pick up support for 1.1830 again today, but I recommend selling below this level only after the pair returns to this range again. In this case, we can expect a larger downward movement to the area of the minimum of 1.1784. Good data on the state of the American labor market may completely collapse the pair to the support of 1.1746, where I recommend fixing the profits. In the EUR/USD growth scenario, the bears will most likely declare themselves only after updating the major resistance of 1.1884, from which you can sell the euro immediately on the rebound, since the moving averages are also in this range, now playing on the side of the bears. If there is no activity at this level, short positions can be considered for a rebound from the resistance of 1.1920, based on a correction of 20-30 points within the day.
Signals of indicators:
Moving averages
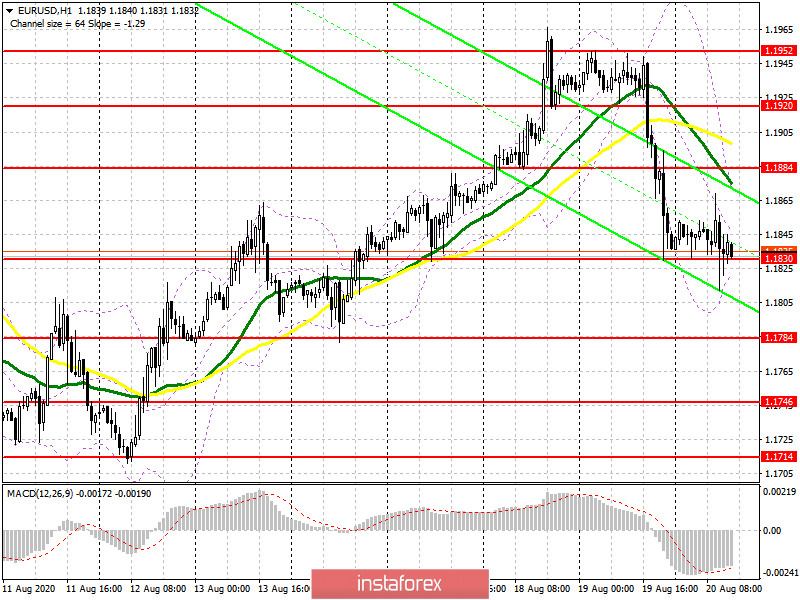
Trading is conducted below the 30 and 50 daily moving averages, which indicates the continuation of the downward correction of the market.
Note: The period and prices of moving averages are considered by the author on the hourly chart H1 and differ from the general definition of the classic daily moving averages on the daily chart D1.
Bollinger Bands
A break in the lower border of the indicator around 1.1784 will increase pressure on the euro. Growth will be limited by the upper level of the indicator in the area of 1.1884.
Description of indicators
InstaForex analytical reviews will make you fully aware of market trends! Being an InstaForex client, you are provided with a large number of free services for efficient trading.

