 Stay
Stay 
Trading Conditions
Products
Tools


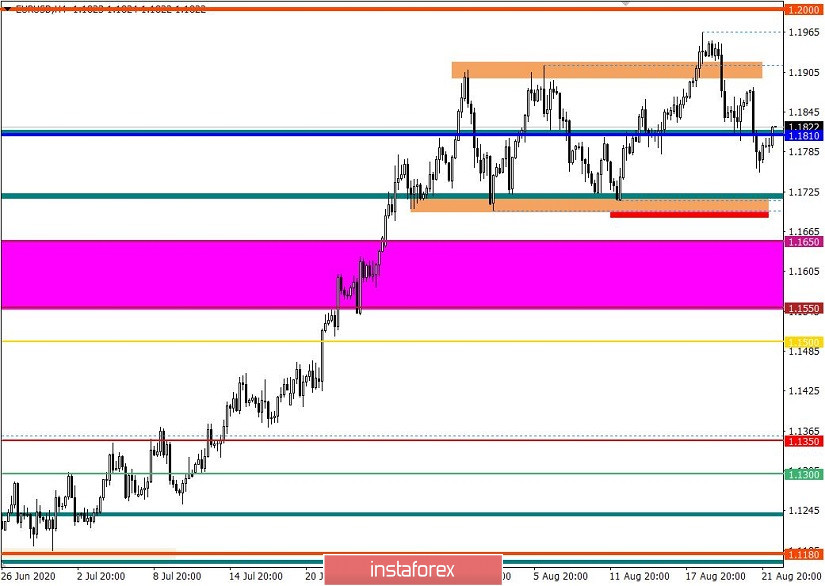
The EUR / USD pair continues to move along the trajectory of the side channel at 1.1700 // 1.1810 // 1.1910, with which the bulls failed to breakout from the upper limit last week
The quote has been trading in a flat for almost a month now, however during this time, market participants still have not managed to break the medium-term upward trend, thereby allowing the European currency to rise one more level in terms of being overbought.
In addition, it is quite hard to change the situation with just an upward move, especially since sales in the US dollar are visible on all fronts. Opposing large players seems to be a terrible idea, and most traders are taking a neutral position, working not with the trend, but with local price changes.
Thus, if we analyze the M30 chart last Friday, we will see that the round of short positions appeared at the start of the European session and lasted until 14:30, where the quote managed to go below the average level of the side channel, at 1.1810.
It brought volatility of about 128 points, which is 50% higher than the average level. A surge in speculative activity is recorded throughout the market, for example, the correlated GBP / USD currency pair, reflected the highest dynamics in 80 trading days, which is considered not a typical phenomenon, as a growth in speculation can lead to an imbalance in the flat pattern.
Nonetheless, as discussed in the previous review , price moved along a downward trajectory, after the quote returned to the limits of the flat pattern.
Hence in the daily chart, an attempt of keeping the upward trend is visible, but the quote remained in the flat since market participants are still in the process of a slowdown.
One of the news released last Friday was the report on preliminary indicators of business activity in the European Union, where instead of growth, a rapid decline was recorded in the indices. The manufacturing sector shrank from 51.8 to 52.6, while the service sector completely slid from 54.7 to 50.1, almost reaching a parity of 50.0.
It led to the weakening of the European currency and a price reduction in the EUR / USD pair.
In the afternoon, similar data were published for the United States, but contrary to the EU, the service sector of the US accelerated from 50.0 to 54.8, and the manufacturing sector rose from 50.9 to 53.6. Sales in the secondary housing market also increased to 24.7% in July, instead of 14.7%
As a result, demand for the US dollar rose, which added to the downturn of the EUR / USD pair.
Further development
Analyzing the current trading chart, we can see that the quote fluctuated within 1.1810 and consolidated above it, having similar dynamics to the movement last August 20.
It may lead to a movement in the direction of 1.1840 - 1.1850, after which the quote will return to the average level of 1.1800 / 1.1810.
To resume the bearish mood, price must consolidate lower than 1.1780, as such will lead to a movement to Friday's low at 1.1754, and then to 1.1700, the lower limit of the side channel.
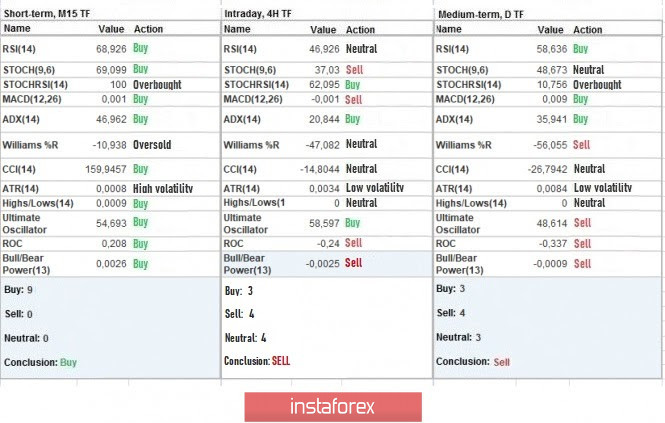
Indicator analysis
Analyzing the different sectors of time frames (TF), we can see that the minute period signals buy due to the current pullback, while hourly and daily periods signal sell due to the downward movement observed on August 19.
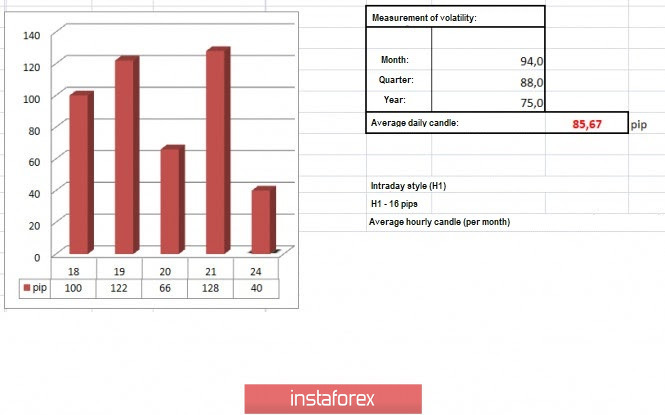
Weekly volatility / Volatility measurement: Month; Quarter; Year
The measurement of volatility reflects the average daily fluctuation, calculated per Month / Quarter / Year.
(August 24's was built, taking into account the time this article is published)
Volatility is currently 40 points, which is 52% below the average value. Many believe that speculative mood is still present, and it is enough to disperse activity in the market.
Key levels
Resistance zones: 1.1910 **; 1.2000 ***; 1.2100 *; 1.2450 **; 1.2550; 1.2825.
Support Zones: 1,1800; 1.1650 *; 1,1500; 1.1350; 1.1250 *; 1.1180 **; 1.1080; 1.1000 ***; 1.0850 **; 1.0775 *; 1.0650 (1.0636); 1.0500 ***; 1.0350 **; 1.0000 ***.
* Periodic level
** Range level
*** Psychological level
Also check the brief trading recommendations for the EUR / USD and GBP / USD pairs here
InstaForex analytical reviews will make you fully aware of market trends! Being an InstaForex client, you are provided with a large number of free services for efficient trading.

