 Stay
Stay 
Trading Conditions
Products
Tools


To open long positions on EURUSD, you need to:
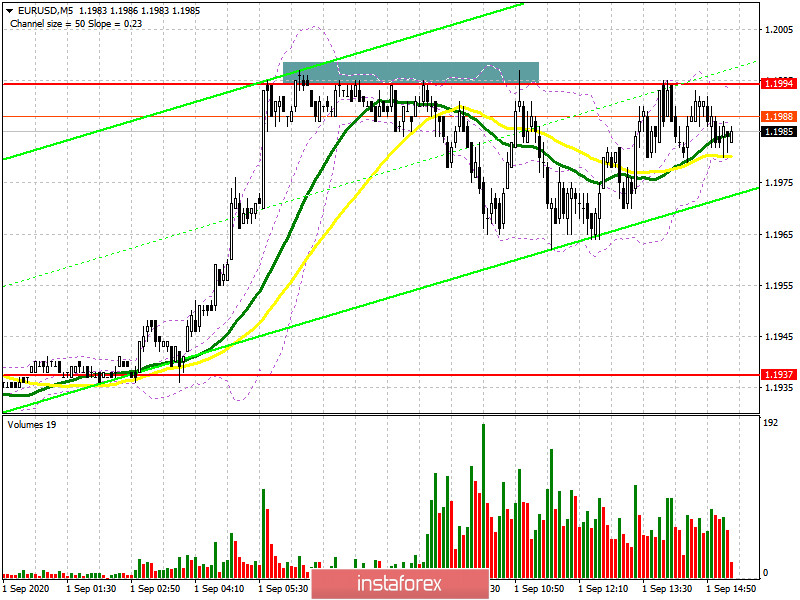
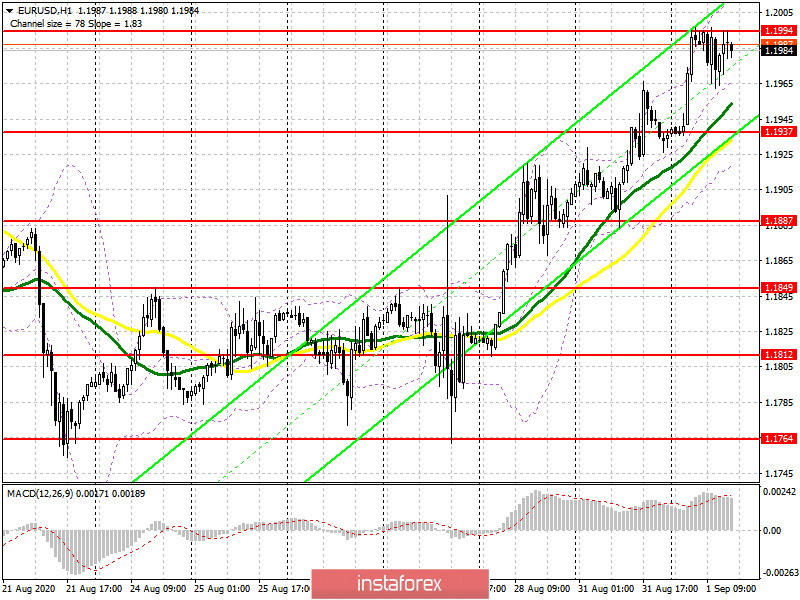
During the European session, traders did not react strongly to the slowdown in business activity in the German manufacturing sector and the fall in Eurozone inflation. However, it was not possible to get beyond the level of 1.1994, which left everything in its place. The only thing you need to pay attention to on the 5-minute chart is the formation of a false breakout in the resistance area of 1.1994 and the formation of a signal to sell the euro, which has so far brought no more than 30 points of profit. Everything clearly indicates that an attempt to break the 20th figure will still be made during the American session. To do this, the bulls need a break of the resistance of 1.1994, which will lead to the demolition of a number of bears' stop orders above this level and to the continuation of the bull market with the renewal of the highs at 1.2022 and 1.2057, where I recommend taking profits. You can buy the euro immediately on the breakdown of this range and there is no need to wait for a consolidation on it. However, a more rational solution in this situation is to buy on the decline of the euro in the support area of 1.1937. There are also moving averages that play on the side of euro buyers. The formation of a false breakout at this level will be a signal to open long positions in the expectation of continuing the upward trend. If there is no activity of buyers at this level, you can safely open long positions for a rebound from the support of 1.1887 in the expectation of a correction of 20-30 points within the day.
To open short positions on EURUSD, you need to:
Sellers of the euro have so far managed to restrain active attempts to break above the resistance of 1.1994, and this was partly due to weak fundamental statistics for the Eurozone. The formation of a false breakout at this level has already led to the formation of a signal to sell the euro and while trading will be conducted below this range, you can expect to strengthen the downward correction to the area of the minimum of 1.1937, where I recommend fixing the profits. However, only after consolidation below this range, it will be possible to speak about the formation of pressure on the pair and its further decline to the area of the minimum of 1.1887. If sellers will not rush to return to the market during the second return of EUR/USD to the resistance of 1.1994 in the afternoon, it is best to postpone short positions until the maximum of 1.2022 is updated or sell EUR/USD immediately to rebound from the resistance of 1.2057 in the expectation of a downward correction of 20-30 points within the day. During the US session, we are waiting for the release of a report on the US ISM manufacturing index, which may return pressure on the European currency. But so far, everything is in favor of the bulls and the market is developing according to their scenario. Therefore, be very careful with sales.
Signals of indicators:
Moving averages
Trading is conducted above the 30 and 50 daily moving averages, which indicates the formation of a bull market.
Note: The period and prices of moving averages are considered by the author on the H1 hourly chart and differ from the general definition of the classic daily moving averages on the D1 daily chart.
Bollinger Bands
If the pair declines, you can open long positions immediately on a rebound from the lower border of the indicator in the area of 1.1925.
Description of indicators
InstaForex analytical reviews will make you fully aware of market trends! Being an InstaForex client, you are provided with a large number of free services for efficient trading.


