 Stay
Stay 
Trading Conditions
Products
Tools


Hourly chart of the EUR/USD pair
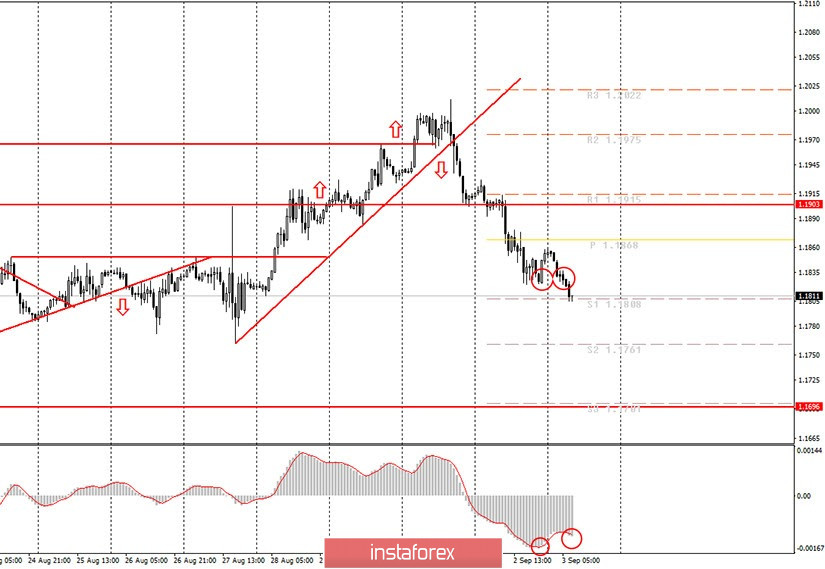
The EUR/USD pair minimally corrected to the upside through the MACD signal (circled by the first circle) last Thursday night, after which it resumed to calmly move down. It was quite difficult for novice traders to reach a new sell signal. First, it formed at night, when most people are asleep. Secondly, the MACD indicator was significantly late in reacting to the downward price reversal. Moreover, if the downward movement continues (strong or weak - it doesn't matter), the indicator will be inclined to start discharging today. We have already discussed such a concept as "discharge" in recent articles. This is a process in which the indicator and the price move in different directions, since the indicator can no longer move in the direction of the price. Thus, novice traders have every right to open new short positions based on the existing sell signal. However, they must clearly understand and be aware of all possible risks and complexity of supporting such a transaction. There is no descending trend line or descending channel. Thus, it is quite difficult to determine the goals of a possible correction.
On September 3, we advise novice traders to pay attention to the Markit services PMI in the euro area, retail sales in the European Union for July, and the ISM PMI in the US services sector. The first report is interesting because it might go below the 50.0 mark again (last month the value slumped to 50.1). And if this happens, it will mean that the service sector is experiencing problems and shrinking again, which will negatively affect the pace of recovery of the entire EU economy. Retail sales in the EU are forecast at 1.5% m/m and 3.5% y/y. If the real values of both indicators are worse than the forecasts, then we can expect the pair to move down in the long term. However, we have to warn you that traders can also easily ignore these reports. The probability of working them out will increase if the actual values are very different from the forecasts. The same applies to the ISM index for the US service sector. The value is expected to decrease from 58.1 to 57.0. Such a reduction is unlikely to create pressure on the dollar. But if, for example, the index falls to 51-52, then the US dollar may start to get cheaper.
Possible scenarios for September 3:
1) Novice traders are advised to not consider buying the pair at this time, since the pair has settled below the rising trend line, so the trend has now changed to a downward trend. In the near future, the upward movement may resume, but now an upward trend line or channel is needed in order to identify a new trend and trade accordingly.
2) Sales are still looking more relevant now. The US dollar is confidently rising in price, but it is difficult to say how long this process will continue. We remind novice traders that the overall fundamental background in the US remains weak, and it contributes to the strong drop in dollar quotes over the past three months. Nevertheless, now it is necessary to trade for a fall. There is a new signal from MACD (although not the most accurate and clear). Thus, it was possible to open short positions on it with the targets of 1.1761 and 1.1701. We believe that these goals are quite achievable. Sell positions can be closed by an upward reversal of MACD, and this is where the difficulty lies - the indicator can be discharged, so you need to catch the moments when both the indicator and the price move upward synchronously.
On the chart:
Support and Resistance Levels are the Levels that serve as targets when buying or selling the pair. You can place Take Profit near these levels.
Red lines are the channels or trend lines that display the current trend and show in which direction it is better to trade now.
Up/down arrows show where you should sell or buy after reaching or breaking through particular levels.
The MACD indicator consists of a histogram and a signal line. When they cross, this is a signal to enter the market. It is recommended to use this indicator in combination with trend lines (channels and trend lines).
Important announcements and economic reports that you can always find in the news calendar can seriously influence the trajectory of a currency pair. Therefore, at the time of their release, we recommended trading as carefully as possible or exit the market in order to avoid a sharp price reversal.
Beginners on Forex should remember that not every single trade has to be profitable. The development of a clear strategy and money management are the key to success in trading over a long period of time.
InstaForex analytical reviews will make you fully aware of market trends! Being an InstaForex client, you are provided with a large number of free services for efficient trading.


