 Stay
Stay 
Trading Conditions
Products
Tools


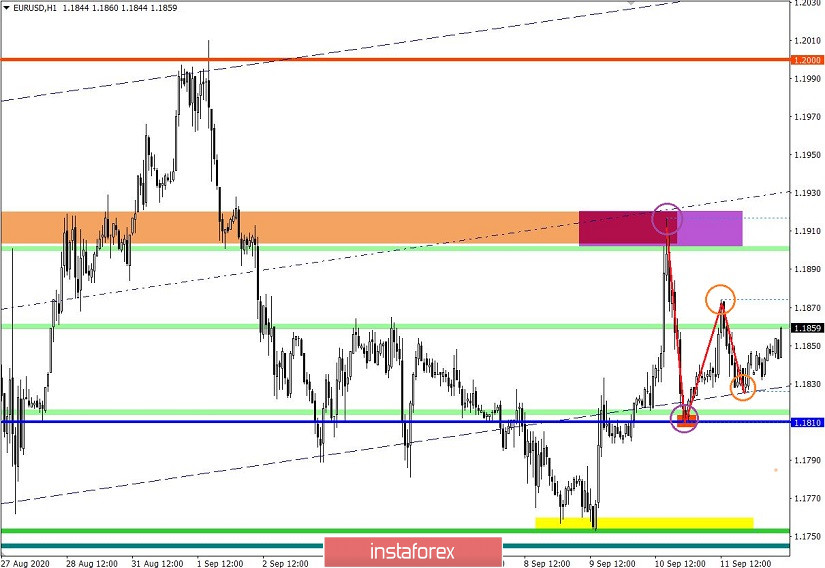
The euro/dollar pair resumed its movement in the structure of the side channel 1.1700/1.1810/1.1910, where the middle level and upper border of the channel are the focus of special attention. The downward activity that has taken place since September 1 has now been recouped by buyers by about half, which indicates that the market is not yet ready for a full-scale downward development. It is perhaps due to this that the previously broken sideways channel was resumed, which traders began to pay attention to.
Analyzing Friday's trading day by the fifteen-minute, you can see that there was an upward interest in the market before noon, which formed a cycle 1.1810 ---> 1.1874. The downward interest resumed from 10:00 UTC+00, which returned the quote to the 1.1825 area.
The sequence of fluctuations from September 1 to the present formed the familiar Zigzag pattern, which compressed the amplitude with each step. This formation can be seen on the hourly period. If we refer to the theory of technical analysis, the compression pattern will lead to a sharp rise in the market, where the signal for action will be the breakdown of one of the values of the previous zigzag turn (buy at 1.1874 and sell at 1.1825). The full development of the zigzag-shaped pattern will occur after the breakdown of the high or low of the primary oscillation of the model.
As discussed in the previous review, the downward trend will only resume after breaking through the level of 1.1810.
Looking at the trading chart in general terms (daily period), you can see a slowdown in the main upward movement, where the psychological level 1.2000 serves as the local high.
Friday's news background contained data on inflation in the United States, where the actual data turned out to be better than expected growth from 1.0% to 1.3% against the forecast of 1.2%. The rise in inflation is a guarantee that the Fed will not cut the refinancing rate. The US dollar received local support on the back of positive data.
In terms of the information background, there were a number of speeches by members of the ECB's Supervisory Board. To start off, Isabel Schnabel spoke out who called for pan-European bonds, in connection with the impractical program of their own government bonds, for each individual EU country. After that, Philip Lane spoke, saying that the risk to the Euro zone economy remains. He urged not to flatter itself over the economic recovery, and the door remains open for a new round of stimulus in the coming months.
In terms of the economic calendar, we have data on the volume of industrial production in the European Union for July, the rate of decline of which may slow down from -12.3% to -7.6%, which is a positive factor, but the decline is still large.
Further development
By analyzing the current trading chart, we can see price fluctuations within the Friday candlestick, which may signal accumulation in anticipation of growth. The trading tactics will be based on the breakout of the boundaries of the previous trading day at 1.1810/1.1874, which is likely to lead to a surge in activity.
Based on the above information, we will display trading recommendations:
- Consider buy deals above 1.1874, with the prospect of moving to 1.1900-1.1910.
- Consider sell deals below 1.1810, with the prospect of moving to 1.1755-1.1700.
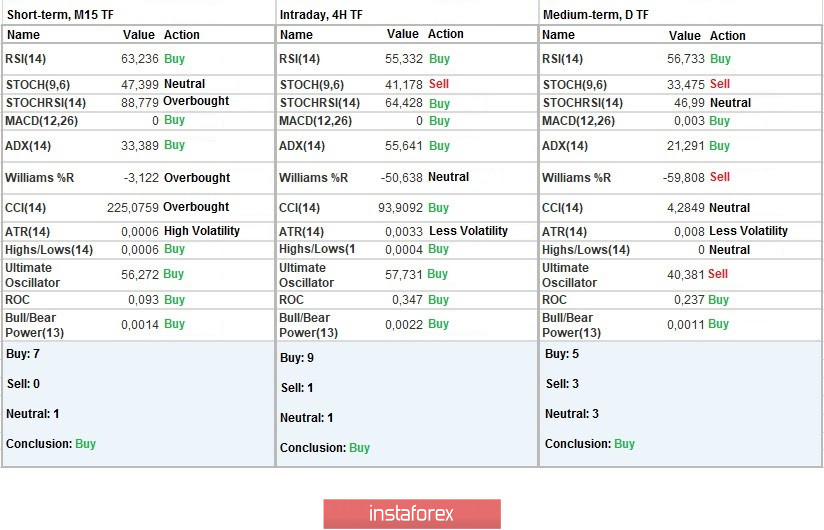
Indicator analysis
Analyzing different sectors of time frames (TF), we see that the indicators of technical instruments on hourly and daily intervals signal a buy by focusing the price above the average level, while minute intervals have a variable signal.
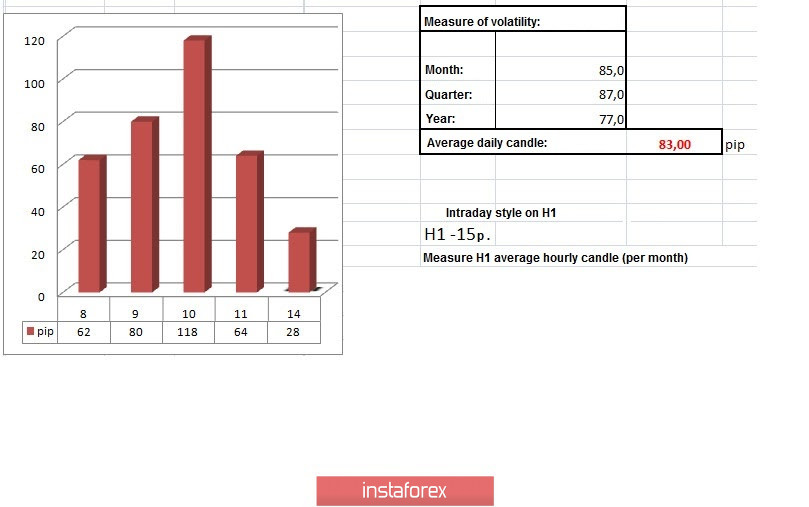
Weekly volatility / Volatility measurement: Month; Quarter; Year
The volatility measurement reflects the average daily fluctuations, calculated per Month / Quarter / Year.
(It was built considering the time of publication of the article)
The current time volatility is 28 pips, which is 66% below the average. It can be assumed that a breakdown of a given amplitude will lead to a local acceleration in the market.
Key levels
Resistance zones: 1.1910 **; 1.2000 ***; 1.2100 *; 1.2450 **; 1.2550; 1.2825.
Support zones: 1.1800; 1.1650 *; 1,1500; 1.1350; 1.1250 *; 1.1180 **; 1.1080; 1.1000 ***.
* Periodic level
** Range level
*** Psychological level
InstaForex analytical reviews will make you fully aware of market trends! Being an InstaForex client, you are provided with a large number of free services for efficient trading.

