 Stay
Stay 
Trading Conditions
Products
Tools


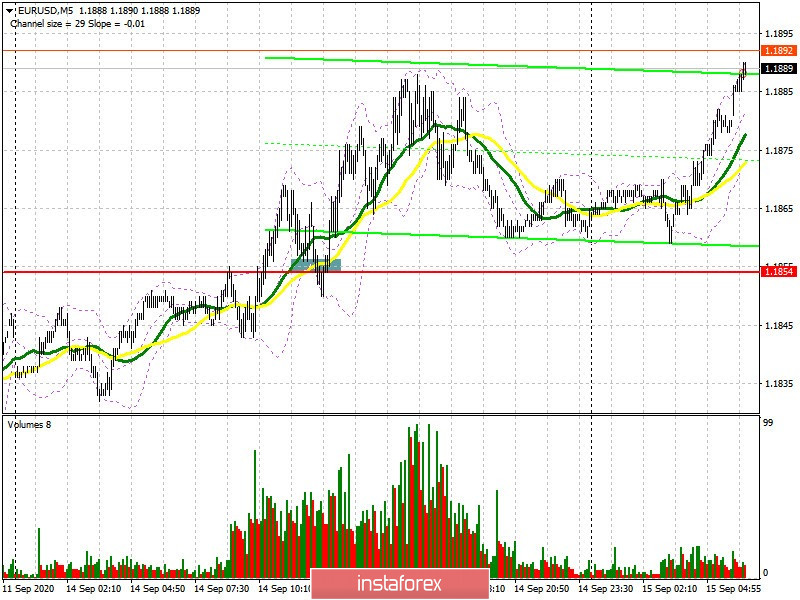
To open long positions on EUR/USD, you need:
Yesterday's report on eurozone industrial production, which increased once again, provided little support for the euro in the morning. Afterwards, a good signal to open long positions appeared. I paid attention to it in my afternoon review. On the 5-minute chart, you can see how the bulls settled above 1.1854 and continued buying the euro. However, this did not lead to a larger upward trend, although closing above 1.1854 itself indicates that the market is on the buyer's side. Today we can expect important fundamental data on sentiment in the euro area, which will determine the market's direction in the long term. As long as trading is carried out above the 1.1854 range, we can expect EUR/USD to rise towards the 1.1905 resistance area. Consolidating above this range, which may occur after good indicators for the eurozone countries, will open a direct road to the highs of 1.1949 and 1.1994, where I recommend taking profits. In case EUR/USD falls in the first half of the day, I recommend considering long positions after forming a false breakout in the support area of 1.1854. If the pair falls below this level again, then I recommend returning to long positions only on a rebound from the larger support at 1.1800, counting on a correction of 20-30 points within the day.
Let me remind you that the Commitment of Traders (COT) reports for September 8 showed that long non-commercial positions decreased from 250,867 to 248,683, while short non-commercial positions also fell from 54,130 to 51,869. Political uncertainty in the US and central bank meetings have forced many traders to wait and see ahead of the fall marathon. As a result, the positive non-commercial net position slightly increased to 196,814, against 196,747, a week earlier.
To open short positions on EUR/USD, you need:
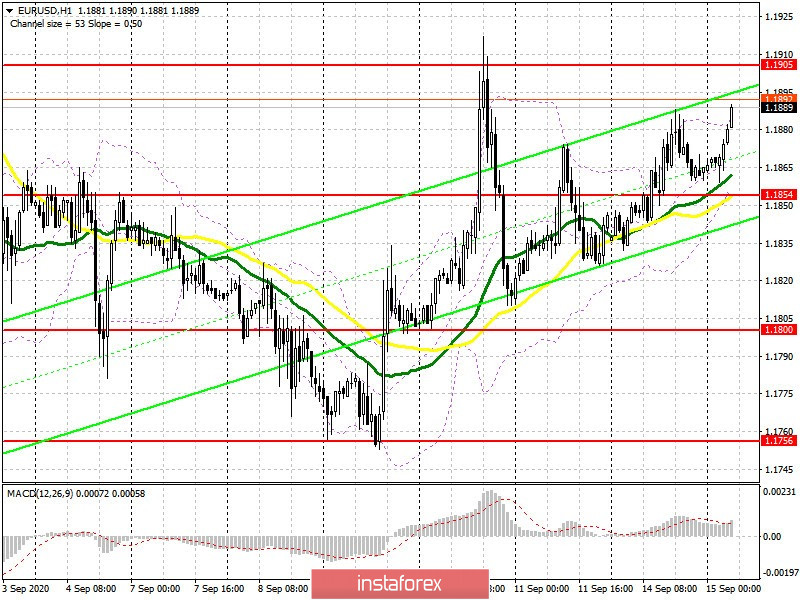
Like yesterday, sellers have the task of returning EUR/USD to the 1.1854 level, since the euro's growth to new weekly highs depends on it, or if major players leave the market and wait for the results of the Federal Reserve meeting tomorrow. Testing the 1.1854 level on the reverse side forms a good entry point into short positions with the main goal of updating the low of 1.1800, which is where I recommend taking profits. A more distant support level is the 1.1756 area, but getting to it will not be easy without receiving support from good US macroeconomic indicators, which will be released this afternoon. If the demand for EUR/USD persists, it is best not to rush to sell, but wait for the resistance test at 1.1905 and open short positions from there, but subject to forming a false breakout. Selling the euro immediately on a rebound is best done from a recent high of 1.1949, counting on a correction of 20-30 points within the day.
Indicator signals:
Moving averages
Trading is carried out above 30 and 50 moving averages, which indicates the bulls' attempt to take control of the market.
Note: The period and prices of moving averages are considered by the author on the H1 hourly chart and differs from the general definition of the classic daily moving averages on the daily D1 chart.
Bollinger Bands
In case of a decline in the pair, support will be provided by the lower border of the indicator in the 1.1854 area.
Description of indicators
InstaForex analytical reviews will make you fully aware of market trends! Being an InstaForex client, you are provided with a large number of free services for efficient trading.


