 Stay
Stay 
Trading Conditions
Products
Tools


What is needed to open long positions on EUR/USD
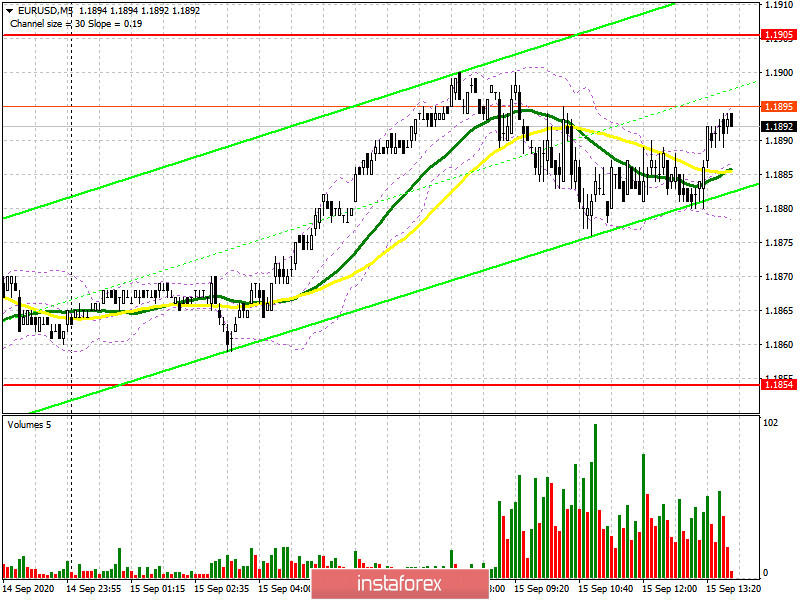
The first half of the trading day is unfolding quietly. Unfortunately, we did not see signals for market entry under such low volatility. EUR found support from the upbeat index of the eurozone's business climate released during the European trade. Meanwhile, large market players refrain from active trade. From the technical viewpoint, trading goals remain unchanged.
Poor macroeconomic data from the US could fix the price above the 1.1905 level. This could open the door to higher levels of 1.1949 and 1.1994 where I would recommend profit taking.
In case EUR/USD declines in the second half of the day, I would recommend considering long positions only after a fake breakout at near support of 1.1854. This is the area where moving averages are passing in favor of the buyers. In case the currency pair drops again below that level, I suggest that you should resume long positions only after the price rebounds from the large support of 1.1800 bearing in mind intraday 20-30 pips correction.
What is needed to open short positions on EUR/USD
The bears set the goal to push EUR/USD back to the level below 1.1854. This move will determine whether EUR will extend a further growth to new weekly highs or whether large players will exit the market to wait for the outcome of the Federal Reserve's policy meeting tomorrow.
Only a test of 1.1854 from the opposite side creates a good entry point for short positions aiming to hit a new low after 1.1800 where I recommend profit taking. A deeper support level is seen at 1.1756. However, it would be hard to reach it without support from strong macroeconomic data on the US which is due in the second half of the day. If demand for EUR/USD remains high which is true judging by the chart, it would be better not to hurry up with short deals. A good idea would be to wait until resistance of 1.1905 is tested and open short deals from there, though on condition of a fake breakout. It would be better to sell EUR at a rally from a fresh high of 1.1949 bearing in mind intraday 20-30 pips correction.
Signals of technical indicators
Moving averages
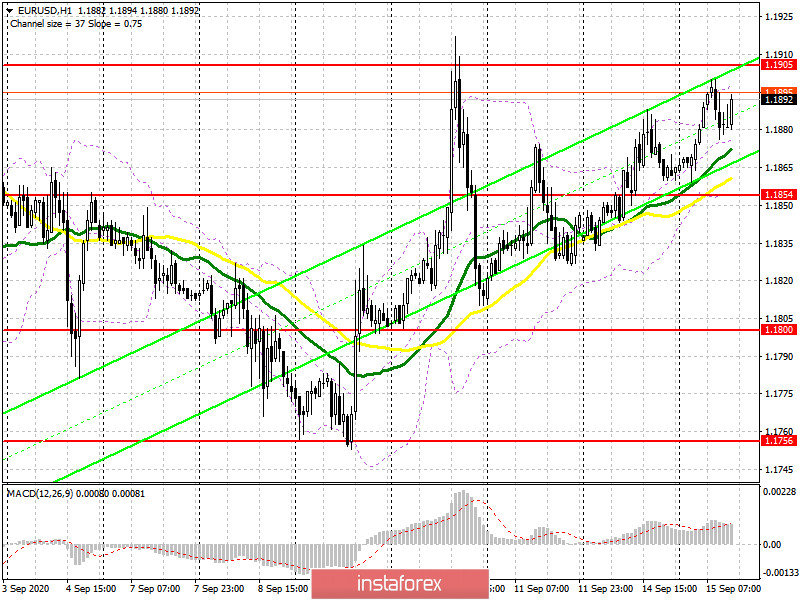
The pair is trading below 30- and 50-period moving averages which indicates the bulls' efforts to resume the upward correction of EUR.
Remark. The author is analyzing a period and prices of moving averages on the 1-hour chart. So, it differs from the common definition of classic daily moving averages on the daily chart.
Bollinger Bands
A breakout of the indicator's upper border at near 1.1900 will trigger a new wave of the EUR advance. In case the currency pair declines, the indicator's lower border at near 1.1854 will serve as support.
Definitions of technical indicators
InstaForex analytical reviews will make you fully aware of market trends! Being an InstaForex client, you are provided with a large number of free services for efficient trading.

