 Stay
Stay 
Trading Conditions
Products
Tools


The pair traded downward on Thursday and tested 1.2866 - a 50% pullback level (red dotted line) and then went up, practically closing the daily candlestick at the opening point. No news is expected as per the economic calendar.
Trend analysis (Fig. 1).
The market may continue to move upward from the level of 1.2975 (closing of yesterday's daily candlestick) with the target of 1.3019 - a 76.4% pullback level (blue dotted line). When this line is reached, the price may continue to move upward with the next target at 1.3209.
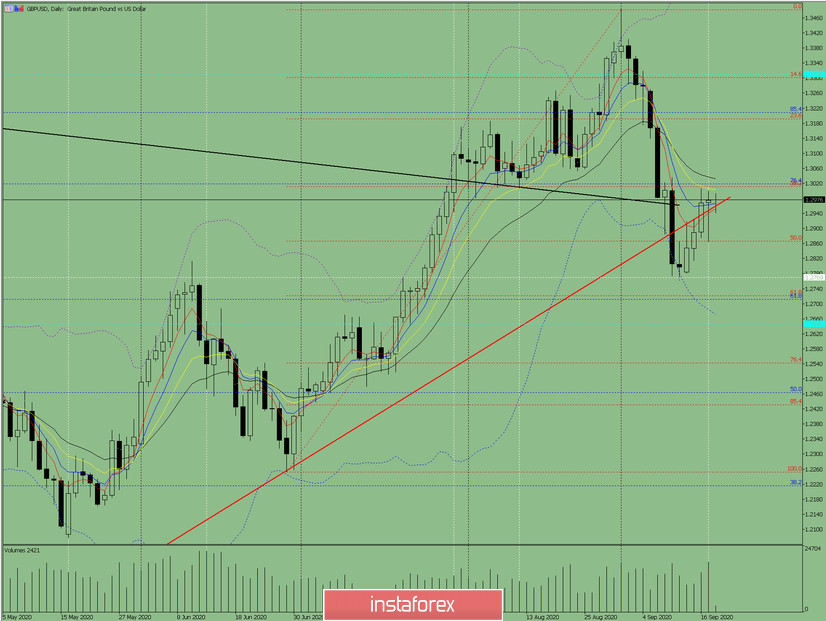
Figure: 1 (daily chart).
Comprehensive analysis:
- Indicator analysis - up;
- Fibonacci levels - up;
- Volumes - up;
- Candlestick analysis - down;
- Trend analysis - up;
- Bollinger lines - down;
- Weekly chart - up.
General conclusion:
Today, the price may continue to move upward from the level of 1.2975 (closing of yesterday's daily candlestick) with the target of 1.3019 - a 76.4% pullback level (blue dotted line). When this line is reached, the price may continue to move upward with the next target at 1.3209.
Another possible scenario: upon testing 1.3019 - a 76.4% pullback level (blue dotted line), the price may move down with the target of 1.2866 - a 50.0% pullback level (red dotted line).
InstaForex analytical reviews will make you fully aware of market trends! Being an InstaForex client, you are provided with a large number of free services for efficient trading.

