 Stay
Stay 
Trading Conditions
Products
Tools


What is needed to open long positions on GBP/USD
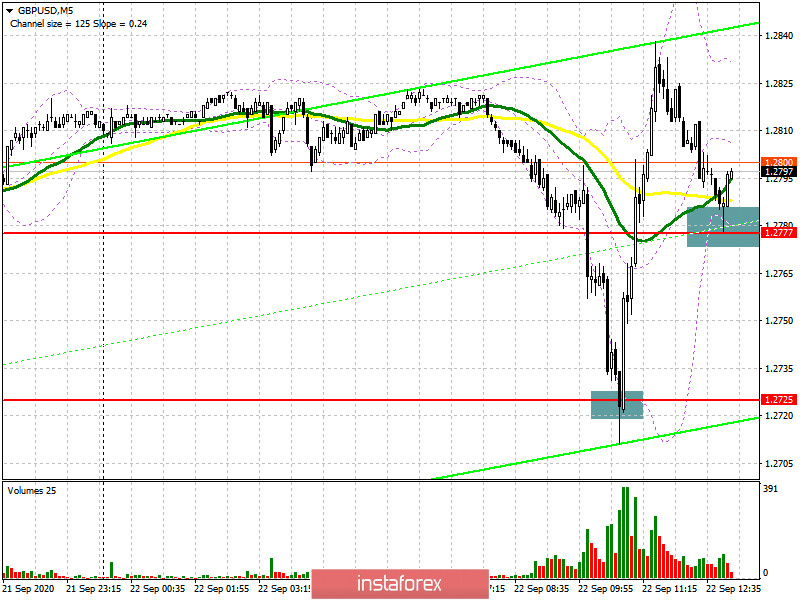
In my morning market review, I pointed out the likelihood of a further GBP decline on condition that the currency pair breaks and stays firmly below the level of 1.2777. This is what exactly happened. However, I haven't seen the convenient market entry point according to my trading strategy. The idea of long deals is a different case. Let's figure out ... If you look at the 5-minute chart, you will see that a breakout of support at 1.2777 did not provide a nice market entry point as the price retraced to that level from the bottom upwards. Unlike this, long positions worked perfectly as the price rebounded from support at 1.2725 that I indicated in my morning review.
As a result, the pair rebounded to the level of 1.2777. The recent test of that area from the top downwards has already provided a good entry point for buying the sterling. While the pair is trading above the level of 1.2777, we can expect GBP/USD to climb further to resistance of 1.2867. The bulls set the task to ensure the price fixation above that level in the second half of the day. Only on this condition, the pair will be able to make a correction to the high of 1.2962 where I recommend profit taking. Otherwise, if the pair fails to develop an active advance from 1.2777 and the bears push the price again below that level, I would advise you to cancel long positions until the low of 1.2725 is tested. Alternatively, I recommend buying the pound sterling during a bounce from a new low of 1.2675, bearing in mind a 30-40 pips correction intraday.
What is needed to open short positions on GBP/USD
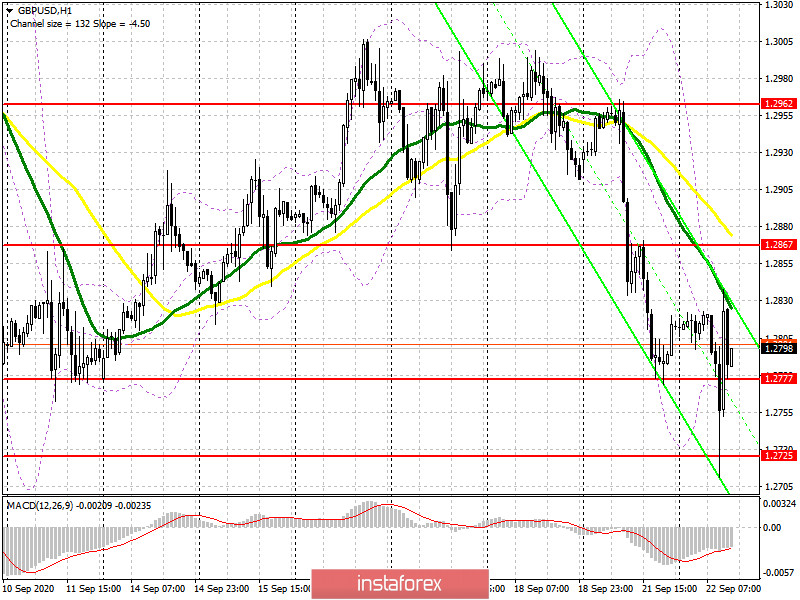
The major task of the sellers is the second breakout and fixation below the support level of 1.2777. Only after these moves are over, we can expect a new signal to sell the sterling. We are free to neglect divergence of the MACD indicator. The key bearish target will be a one-week low of 1.2725 and a deeper level of 1.2675 where I recommend profit taking.
GBP/USD is more likely to grow in the second half of the trading day. This scenario is more plausible now. So, it would be better to wait until the pair forms a higher resistance than 1.2867. You will be able to sell there on a rally relying on the bear market. You can find some help from moving averages which are passing slightly over that range. In case the bears lack activity at 1.2867, it would be better to refrain from selling until the price hits a higher high after 1.2962, bearing in mind a downward 30-40 pips correction intraday.
Signals of technical indicators
Moving averages
The pair is trading below 30- and 50-period moving averages that indicate the persistent bearish trend.
Remark. The author is analyzing a period and prices of moving averages on the 1-hour chart. So, it differs from the common definition of classic daily moving averages on the daily chart.
Bollinger Bands
EUR growth will be capped by the upper level of the indicator at near 1.1835. In case EUR declines, the lower border of the indicator at near 1.1755 will act as support.
Definitions of technical indicators
InstaForex analytical reviews will make you fully aware of market trends! Being an InstaForex client, you are provided with a large number of free services for efficient trading.

