 Stay
Stay 
Trading Conditions
Products
Tools


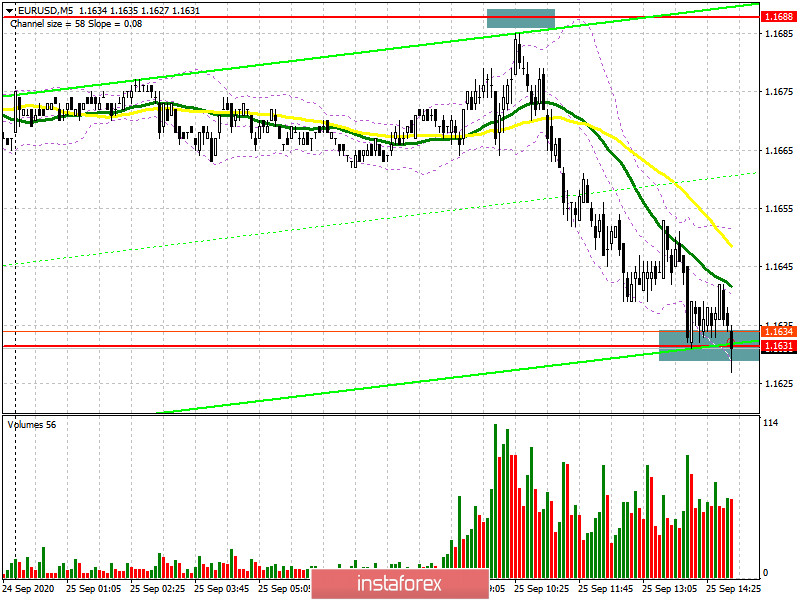
Unfortunately, I did not wait for the formation of a false breakout at the level of 1.1688 in the morning, to which we fell a couple of points short. As a result, the entire downward movement of the euro passed. At the moment, the focus is on the support of 1.1631, and the further direction of the pair will depend on how the pair behaves at this level. The formation of a false breakout forms a signal to buy the euro to return to the area of today's maximum of 1.1688, where I recommend fixing the profits. In the scenario of a further decline in the EUR/USD trend under this level, it is best to wait for the update of the new local support of 1.1585 and open long positions on the pair, counting on correction of 20-30 points within the day. There may be a fairly large surge in the volume area of 1.1585 that will also indicate the exit of major sellers of the euro from the market after the trend movement observed since the beginning of September this year.
To open short positions on EURUSD, you need to:
Sellers of the euro formed a downward movement of the pair a little earlier than predicted and their main task in the afternoon will be to break through and consolidate below the local minimum of 1.1631. A test of this level from the bottom up after the breakout forms a good entry point for short positions in the expectation that the euro will continue to decline along with the trend to the area of the minimum of 1.1585. Fairly large profit-taking on short positions may occur here. If there is no movement of the pair up from this area, you can expect to update the minimum of 1.1541. In the scenario of forming a false breakout at 1.1631 in the afternoon, I recommend not to rush with sales, but to wait for the repeated test of the maximum of 1.1688 and sell the euro from there immediately on the rebound in the expectation of correction of 20-30 points within the day.
Signals of indicators:
Moving averages
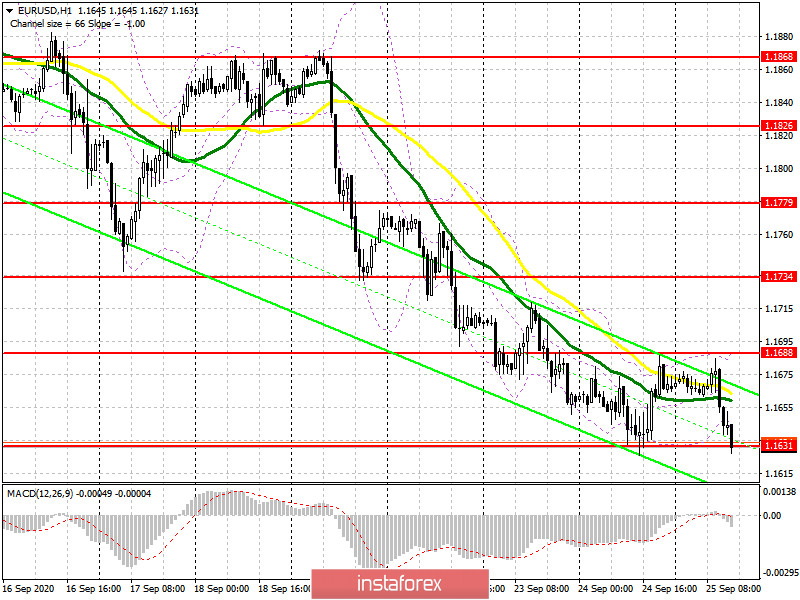
Trading is conducted below 30 and 50 daily moving averages, which indicates continued pressure on the euro and the formation of a bear market.
Note: The period and prices of moving averages are considered by the author on the hourly chart H1 and differ from the general definition of classic daily moving averages on the daily chart D1.
Bollinger Bands
A break of the lower limit of the indicator in the area of 1.1631 will lead to a larger decline in the euro. Growth will be limited by the upper level of the indicator in the area of 1.1688.
Description of indicators
InstaForex analytical reviews will make you fully aware of market trends! Being an InstaForex client, you are provided with a large number of free services for efficient trading.


