 Stay
Stay 
Trading Conditions
Products
Tools


To open long positions on EURUSD, you need:
The Eurozone consumer confidence indicator coincided with the forecasts of economists, which preserved the position of buyers of the European currency and opened up new opportunities for them to strengthen the pair. If you remember my morning forecast and the level of 1.1688, you will surely see that the signal to buy the euro from this range has justified itself. The 5-minute chart clearly shows how the bulls took another resistance of 1.1688, fixing on which made it possible to update the weekly highs. However, we have not yet reached a key goal in the area of 1.1734. This is where I recommend fixing profits. The longer-term goal will be a maximum of 1.1779, however, it will be very difficult to reach this level. In the scenario of a decline in EUR/USD in the afternoon, it is best to return to purchases after the formation of a false breakout in the support area of 1.1688. The larger level is still below the moving averages at 1.1640, where you can buy the euro immediately on the rebound.
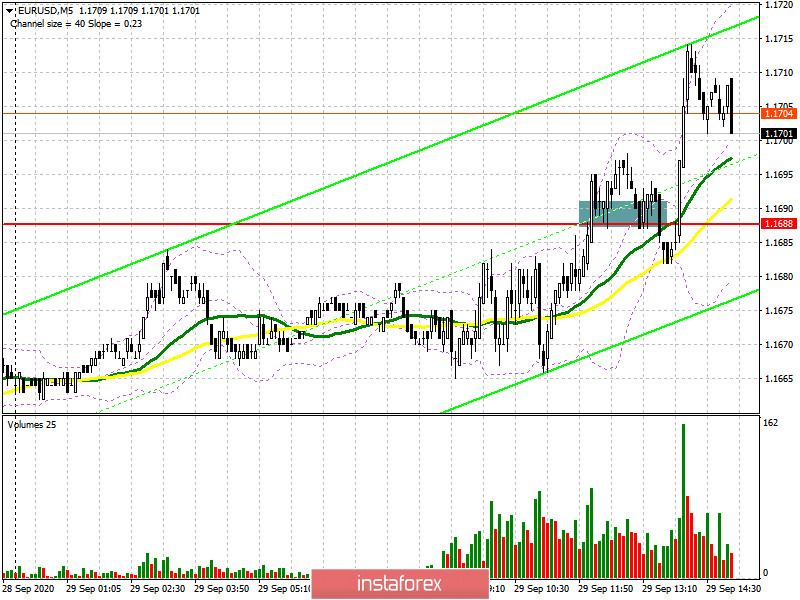
To open short positions on EURUSD, you need:
Sellers of the euro decided not to force events and retreated from the level of 1.1688, as it was recently with the area of 1.1640. The task for the second half of the day will be to return this range and fix it under it. The bottom-up test of 1.1688 forms a good entry point for short positions in the expectation of a continuation of the bearish trend, which will open a direct prospect for a decline in the euro to the area of the lows of 1.1640 and 1.1585, where I recommend fixing the profits. If the bulls are stronger and continue the upward correction in the pair, then you should not rush to sell. The data on the consumer confidence indicator may likely be worse than economists' forecasts, which will lead to a more powerful bullish momentum for the pair. Therefore, it is best to wait for the update of the maximum of 1.1734 or open short positions immediately for a rebound from the resistance of 1.1779 in the expectation of correction of 20-30 points within the day.
Let me remind you that COT reports (Commitment of Traders) for September 22 recorded an increase in both long and short positions, however, the first ones turned out to be more. Such a low euro exchange rate for the first time in the last three months attracts new buyers, even despite the risk of a second wave of coronavirus infection across Europe. For example, long non-profit positions increased from 230,695 to 247,049, while short non-profit positions increased from only 52,199 to 56,227. The total non-commercial net position also rose during the reporting week to 190,822 from 178,576 a week earlier, indicating the bullish market sentiment in the medium term. The more the euro declines against the US dollar, the more attractive it will be for new investors.
Signals of indicators:
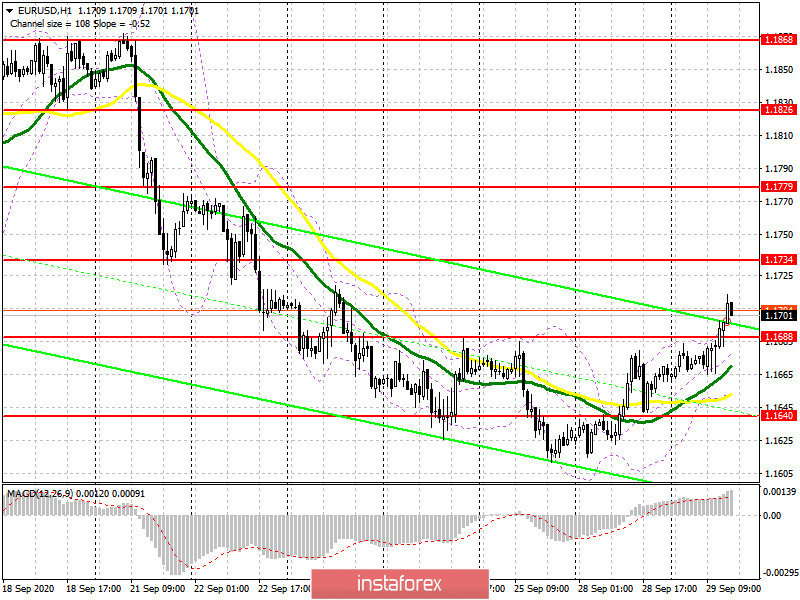
Moving averages
Trading is conducted above 30 and 50 daily moving averages, which indicates the continuation of the upward correction of the euro.
Note: The period and prices of moving averages are considered by the author on the hourly chart H1 and differ from the general definition of classic daily moving averages on the daily chart D1.
Bollinger Bands
If the pair declines in the second half of the day, the lower border of the indicator in the area of 1.1655 will provide support.
Description of indicators
InstaForex analytical reviews will make you fully aware of market trends! Being an InstaForex client, you are provided with a large number of free services for efficient trading.


