 Stay
Stay 
Trading Conditions
Products
Tools


Trend analysis.
The price from the level of 1.2931 (closing of the last weekly candle) is expected to decline this week in order to reach the support line - 1.2764 (white thin line). If this line is tested, further upward movement is possible with the goal of 1.2982 - the pullback level of 38.2% (blue dotted line).
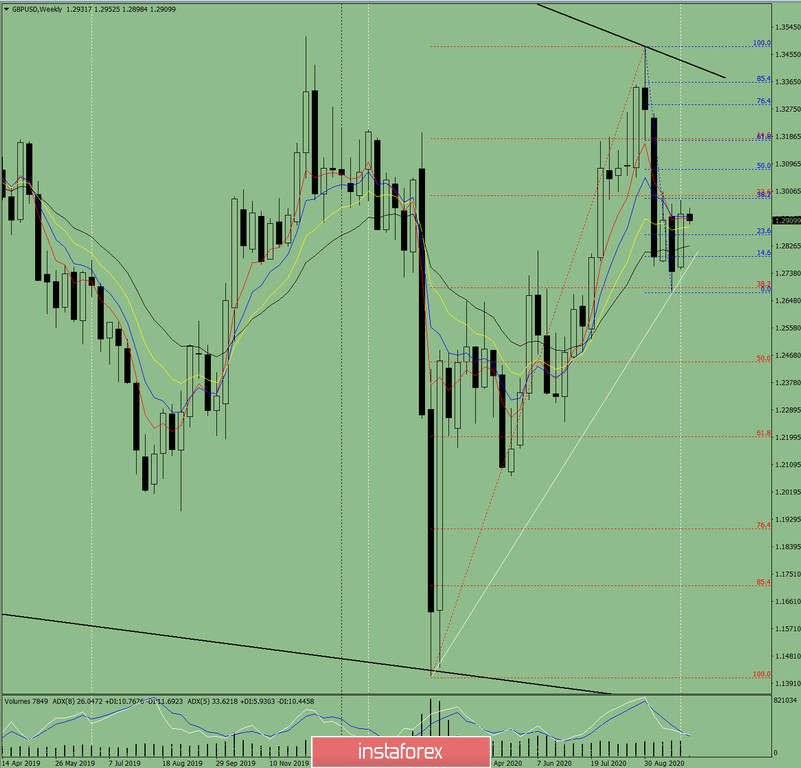
Figure: 1 (weekly chart).
Comprehensive analysis:
- indicator analysis - down;
- Fibonacci levels - down;
- volumes - down;
- candlestick analysis - down;
- trend analysis - up;
- Bollinger lines - up;
- monthly chart - up.
A downward movement can be concluded based on a comprehensive analysis.
The general result of calculating the candlestick of the GBP/USD pair according to the weekly chart: this week, the price is likely to have a downward trend without the first upper shadow of the weekly black candlestick (Monday - down) and with the second lower shadow (Friday - down).
The first downside target is the support line at 1.2764 (blue dashed line). If this line is tested, it is likely to further increase with the goal of 1.2982 - the pullback level of 38.2% (blue dotted line).
An unlikely scenario: from the level of 1.2931 (closing of the last weekly candle), a downward movement in order to reach the support line - 1.2764 (white thin line) is unlikely.
InstaForex analytical reviews will make you fully aware of market trends! Being an InstaForex client, you are provided with a large number of free services for efficient trading.


