 Stay
Stay 
Trading Conditions
Products
Tools


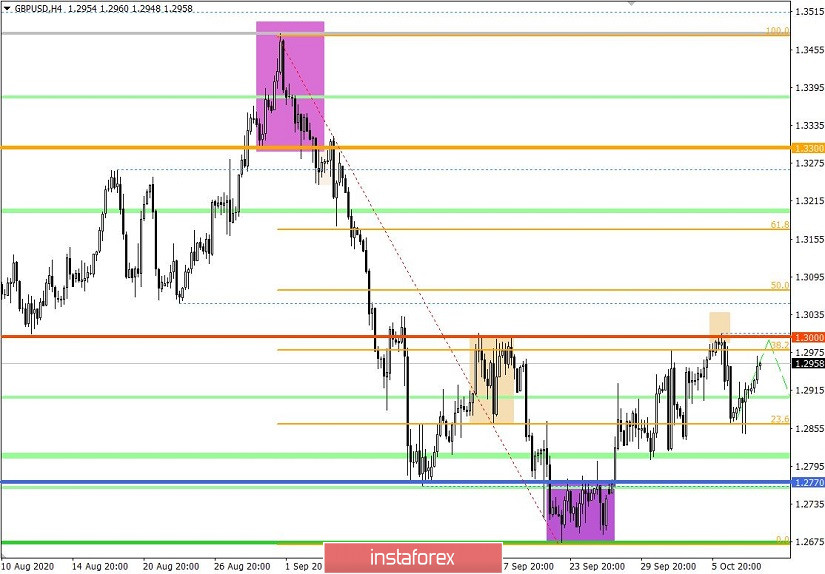
The GBP/USD currency pair found a pivot point in the area of 1.2865 after a rapid decline, which naturally coincides with the price fluctuation from September 16-18. The swing range is quite wide 1.2865/1.3000, but as long as the quote is below the psychological level, a downward development in the market is very likely.
The downward tact set in the September period may be broken if the price is consolidated above 1.3050 on the daily time frame, which will reduce the volume of short positions and restore the medium-term upward trend.
Analyzing the last trading day by the fifteen-minute TF, you can see a V-shaped formation, where a turn of short positions appeared at 8:15 and 11:00, and the round of long positions was observed at 11:15 and 15:00 (low - 1.2846; high - 1.2928). The V-shaped formation is considered complete, and the breakdown of the upper limit occurred during the Asian session of the following day.
In terms of daily dynamics, the lowest indicator for six trading days was recorded yesterday. It amounted to 82 points, which is 34% below the average. It is worth considering that when considering the minute and hour intervals, speculative activity is systematically observed, as proven by the recent V-shaped formation.
As discussed in the previous analytical review, traders considered the scenario of repetition of the amplitude fluctuation of the period of September 16-18, where coordinates 1.2865 acts as a pivot point.
Looking at the trading chart in general terms (daily period), we can see a corrective move from the local low of 1.2674, where the psychological level of 1.2770 serves as a resistance.
Yesterday's news background did not have any significant statistical data, but the minutes of the FOMC's September meeting were published, which turned out to be not surprising for traders since the details were already known. However, it is clear from the document that members of the Fed are worried about the lack of additional fiscal stimulus, as this threatens the economic recovery. At the same time, they note that the current rate of economic growth exceeds its earlier forecasts.
In terms of the information background, we see that the UK is playing its game in Brexit, periodically voicing ultimatums, as well as threatening the EU. Recently, there was another statement from London. They are trying to reach an agreement on trade relations after leaving the EU by mid-October, but they are ready if the negotiations fail. Such behavior, as well as emotions, will intensify, since there is no time left, and a decision still needs to be made.
At the same time a political split in the UK will be expected. The conservatives are unhappy with Boris Johnson's strategy to contain COVID-19 as well as the remaining issue around Brexit. Thus, there are rumors tha Johnson may be replaced by Treasury Secretary Rishi Sunak and that he has already begun meeting with MPs who may support his candidacy.

In terms of the economic calendar, US weekly data on claims for unemployment benefits will be published, where their volume is expected to decline.
Initial applications can be reduced from 837,000 to 820,000, while reorders can be reduced from 11,767,000 to 11,400,000.
Further development
Analyzing the current trading chart, a round of long positions was seen during the Asian session, where the quote has already managed to recover by more than 75% against the decline last October 6. Meanwhile, fluctuations in the amplitude of 1.2865/1.3000 will still remain for some time on the market, where we can work within the specified limits and on their breakdown.
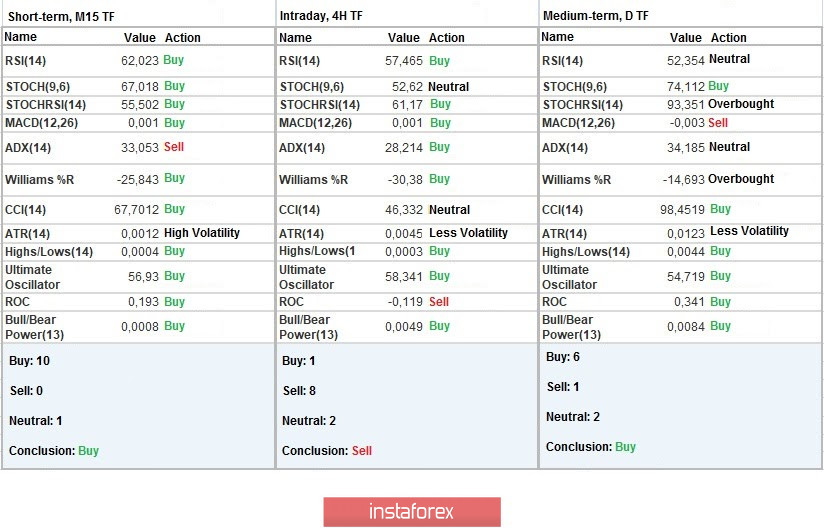
Indicator analysis
Analyzing different sectors of time frames (TF), we see that the indicators of technical instruments signal a buy, ast the quote is near the psychological level of 1.3000.
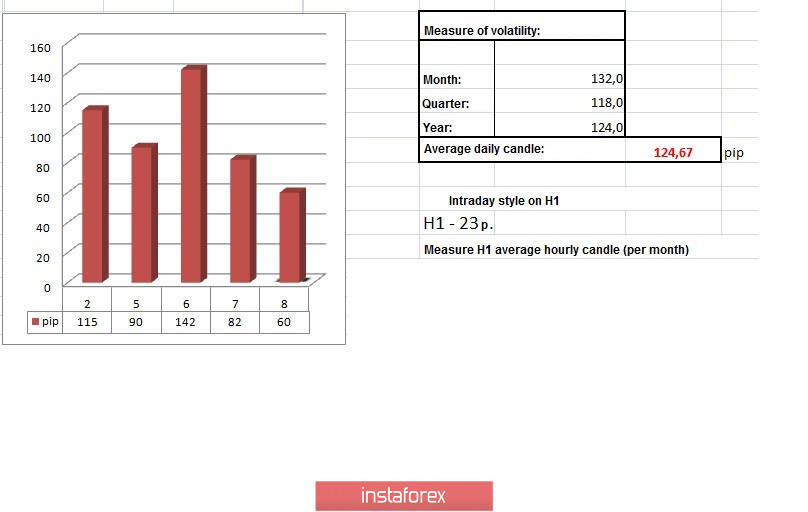
Weekly volatility / Volatility measurement: Month; Quarter; Year
The volatility measurement reflects the average daily fluctuations, calculated per Month / Quarter / Year.
(October 8 was built taking into account the time of publication of the article)
The dynamics of the current time is 60 pips, which is 51% below the average. We can assume that the daily indicator will be below the average level, if the price is kept within the amplitude. In turn, local surges are not excluded due to the large number of speculators in the market.
Key levels
Resistance zones: 1.3000 ***; 1.3200; 1.3300 **; 1.3600; 1.3850; 1.4000 ***; 1.4350 **.
Support zones: 1.2770 **; 1.2620; 1.2500; 1.2350 **; 1.2250; 1.2150 **; 1.2000 *** (1.1957); 1.1850; 1.1660; 1.1450 (1.1411).
* Periodic level
** Range level
*** Psychological level
InstaForex analytical reviews will make you fully aware of market trends! Being an InstaForex client, you are provided with a large number of free services for efficient trading.

