 Stay
Stay 
Trading Conditions
Products
Tools


EUR/USD 1H
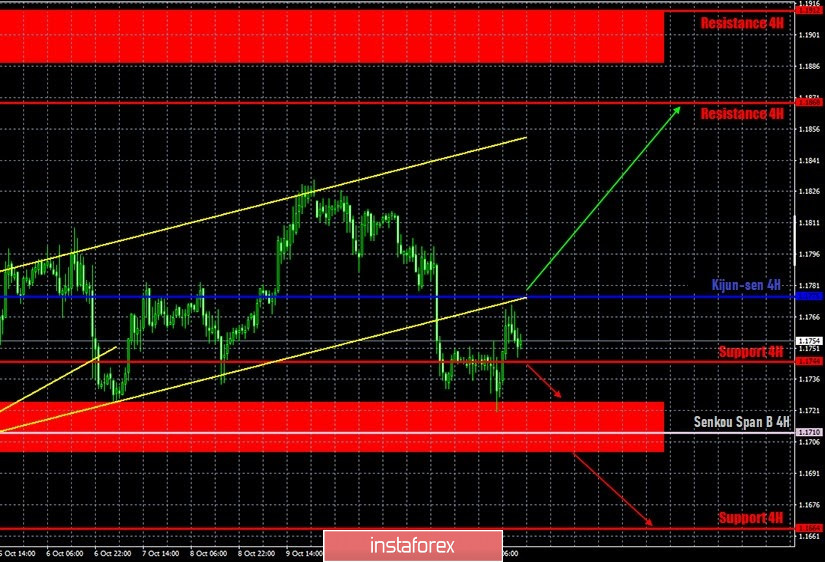
The euro/dollar pair "crawled" to the support area of 1.1701-1.1725 and, barely touching it, immediately rebounded on the hourly timeframe on October 14. Thus, on the one hand, we see that the price has settled below the ascending channel, which indicates a change to a downward trend, on the other hand, traders failed to overcome the first obstacle on their way. Accordingly, current prospects for a succeeding downward movement appear rather vague. Bears need to tighten up and overcome the area of 1.1701-1.1725, within which the Senkou Span B line also lies, which is also quite strong support. At the same time, buyers released the initiative, and there is no question of returning to an upward trend either unless the price settles above the Kijun-sen line.
EUR/USD 15M
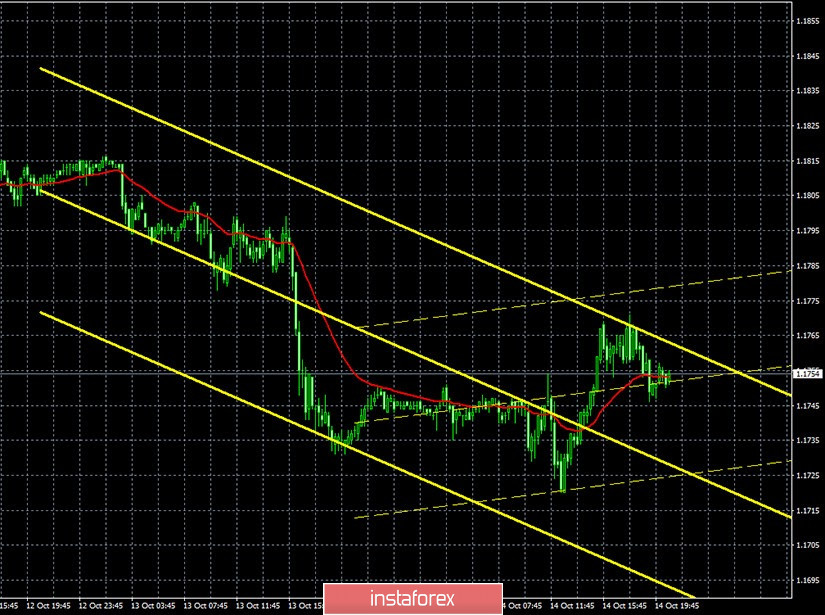
Both linear regression channels turned down on the 15-minute timeframe, which fully corresponds to the picture of what is happening on the hourly timeframe. The lower charts do not provide any signs of completing the correction cycle on the hourly timeframe.
COT report
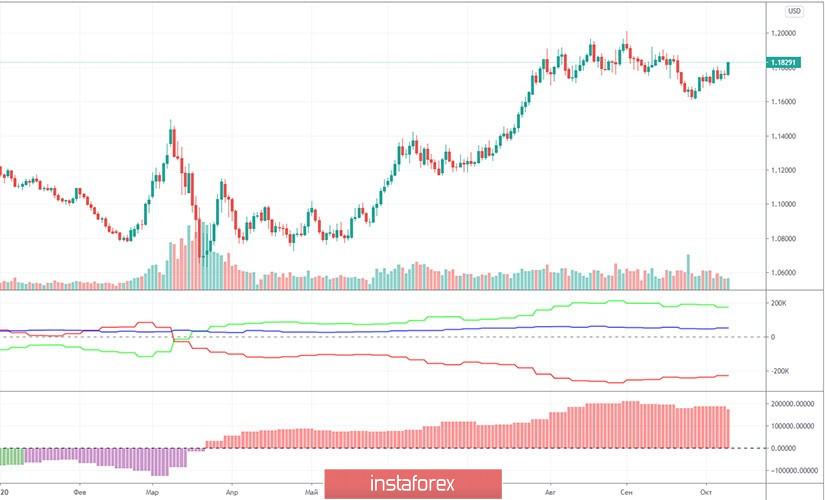
The EUR/USD pair has risen in price by about 120 points during the last reporting week (September 29 - October 5). But in general, there are still no significant price changes for the pair. In fact, all trades are held in a horizontal range of 250-300 points. Thus, data from any Commitment of Traders (COT) report can only be used for long-term forecasting. The latest COT report showed that non-commercial traders, which we recall, are the most important group of traders in the forex market, closed 10,784 Buy-contracts (longs) and opened 2,078 Sell-contracts (shorts). Take note that two weeks earlier, the "non-commercial" group was relatively active in building up long positions, but now it is decreasing its net position for the second consecutive week. This may indicate that the upward trend for the pair is over. Or it is about to end. We have already said that the lines of the net positions of the "commercial" and "non-commercial" groups (upper indicator, green and red lines) diverge strongly when a trend change occurs. If this is the case, the peak point of the upward trend will remain at $1.20. The net position of non-commercial traders was at its highest (green line) at this point. After reaching this level, it falls steadily. Thus, the pair may try to make another upward breakthrough as a final assault on the bulls, but you should hardly expect the pair to go much higher than the 20 figure.
No macroeconomic background for EUR/USD on Wednesday, October 14. The only report of the day that could attract the attention of traders is the eurozone industrial production data for August. However, this report showed that the growth was only 0.7% in monthly terms, while the forecast was +0.8%. Thus, the fact that it nearly coincided with the forecast does not always provoke traders to react strongly to it. Therefore, from a fundamental point of view, it was inexplicable when the US dollar strengthened (the dollar gew against the pound) the day before yesterday. In addition to this is when the greenback fell yesterday (it also fell against the pound). Consequently, the reasons, if any, lie either in the United States, or are precisely connected with the US currency. However, the only report that was published in the US on Tuesday was the inflation report, which could not cause a strong rise in the dollar. Because its values were not optimistic or strong. Moreover, traders have been ignoring most of the macroeconomic reports lately. There is no reason to believe that the recent US inflation report was an exception. But there was no more general news on Wednesday at all. Not from US President Donald Trump, not from Democrats, not from Republicans, not from Federal Reserve Chairman Jerome Powell, not from US Treasury Secretary Stephen Mnuchin, not from US presidential candidate Joe Biden.
We have two trading ideas for October 15:
1) The pair has left the ascending channel, so buyers are not dominant in the market right now. You can consider taking new long positions only if the quotes return above the critical line (1.1775) and then you can aim for the resistance level of 1.1868 and even then, you should only take them in small lots. Take Profit in this case will be up to 80 points.
2) Bears have now made another attempt to start forming a downward trend, but immediately failed around 1.1720. So now sellers need to pressure the area of 1.1701-1.1725 and only after that should you open new sell positions while aiming for the support level of 1.1664. In this case, the potential Take Profit is up to 30 points. Not much, but the current volatility is not too high. You can also try to trigger a rebound from the Kijun-sen line, but in small lots while aiming for 1.1720.
Explanations for illustrations:
Support and Resistance Levels are the levels that serve as targets when buying or selling the pair. You can place Take Profit near these levels.
Kijun-sen and Senkou Span B lines are lines of the Ichimoku indicator transferred to the hourly timeframe from the 4-hour one.
Support and resistance areas are areas from which the price has repeatedly rebounded off.
Yellow lines are trend lines, trend channels and any other technical patterns.
InstaForex analytical reviews will make you fully aware of market trends! Being an InstaForex client, you are provided with a large number of free services for efficient trading.


