 Stay
Stay 
Trading Conditions
Products
Tools


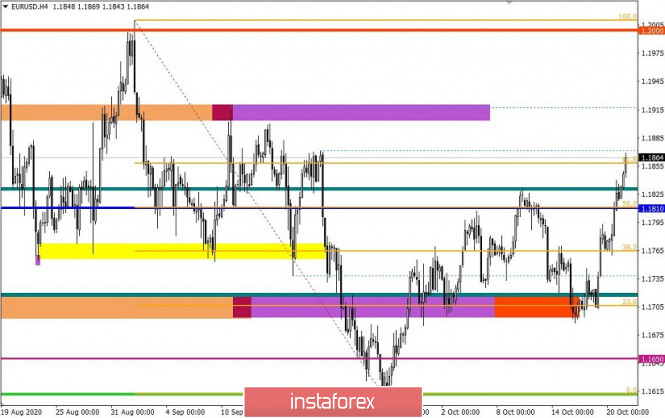
Since the trading week began, buyers have been dominating the market. The quote never broke the support level of 1.1700, instead, an upward inertial move appeared, which managed to break through the local high on October 9 - 1.1830. In fact, we are faced with the prolongation of the main correctional movement from the local low of 1.1612, where there is a risk of a full recovery relative to the scale of the decline in September 1.2011 ---> 1.1612. The euro's strengthening for three weeks has already led the quotes to return to the limits of the previously passed side channel (1.1700 / 1.1810 / 1.1910), but this may only be the beginning if the market consistently passes the 1.1900 and 1.2000 areas.
Now, only two facts are confusing in the structure of the upward movement: the recent intensity and speculative excitement. That is, the market is subject to pressure, for example, from information flow, which sets a local course, which can change at any time. This can result in a reduction in trading volumes (customer volume).
In this case, it will not be logical to set a medium-term forecast until technical and fundamental analysis indicate a single direction.
Analyzing yesterday's fifteen-minute period, you can see that the round of long positions appeared during the European session and lasted until 14:30 UTC+00, where the local high (1.1830) on October 9 was updated, which was then followed by a slowdown, with a slight pullback.
For yesterday's daily dynamics, an indicator of 80 points was recorded, which is 4% higher than the average level. We should note that there has been an acceleration for the second day in a row, which is confirmed by a high coefficient of speculative transactions in the market.
Looking at the trading chart in general terms (daily period), you can see the recovery process relative to the decline in September, which is 62% today.
In terms of news background, US construction data was published yesterday, where its volume rose by 2.8% against the forecasted 1.9%, while the number of issued building permits rose by 5.2% at all against the forecasted 1.8%.
The information flow includes the bilateral negotiations between England and Brussels, where the negotiators exchanged views, but apparently did not progress into anything. Michel Barnier tweeted that he spoke to Mr. Frost and told him to make the most of their remaining time.
According to Bloomberg, there are sources close to senior EU diplomats that claim that they do not pay attention to Boris Johnson's posturing and even pretend that he is a winner in everything.
These words probably mean that the EU is focused on concessions from England, which will help to conclude a trade deal.

In terms of the economic calendar, there are no significant statistics from Europe and the US, so all attention will be focused on the information flow.
Further development
Analyzing the current trading chart, you can see a rapid price growth, where the stagnation area on September 10-18 (1.1850/1.1900) was already reached, which can affect the lead to a volume reduction of long positions, if the speculative excitement will not slow down.
In this case, it is worth considering two possible development scenarios at once:
The first scenario includes the natural basis of the slowdown of 1.1850/1.1900, where we can observe a decline in trading volumes, which can result in a slowdown/pullback.
The second one is focused on speculative activity, where another round of speculation may arise in view of information flow. Now, holding the quote above the level of 1.1910 may lead to a full recovery relative to the decline in September.
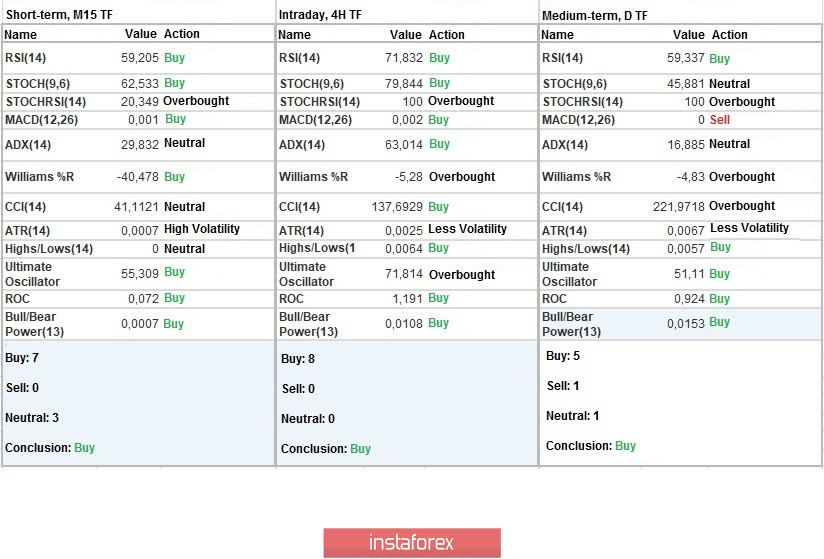
Indicator analysis
Analyzing different sectors of time frames (TF), we see that the technical indicators are unanimously signaling to buy. The minute TF reflects inertia and speculation, while hourly and daily TFs indicate recovery.
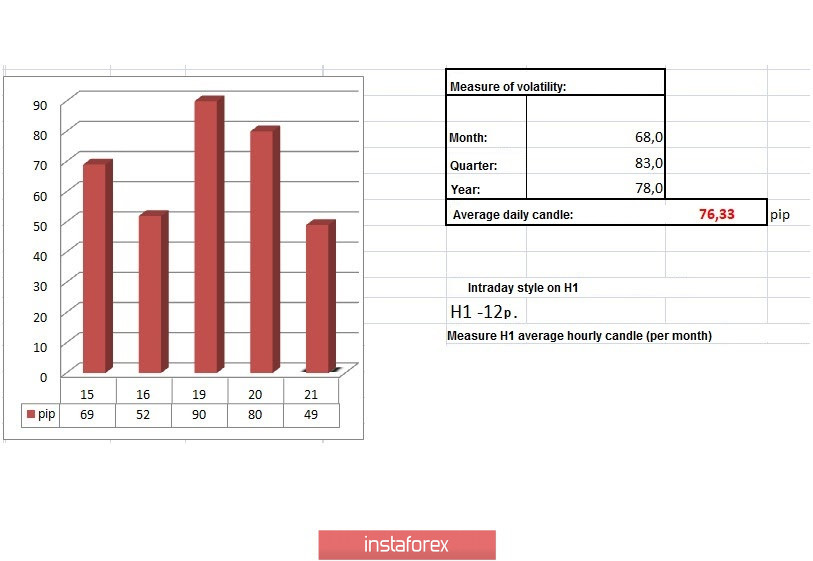
Weekly volatility / Volatility measurement: Month; Quarter; Year
Measurement of volatility reflects the average daily fluctuation, calculated per Month / Quarter / Year.
The volatility of the current time is 49 points, which is even 35% lower than the average level, but this can change immediately due to speculative excitement.
Key levels
Resistance zones: 1.1910; 1.2000***; 1.2100*; 1.2450**; 1.2550; 1.2825.
Support zones: 1.1810; 1.1700; 1.1650*; 1,1500; 1.1350; 1.1250*; 1.1180**; 1.1080; 1.1000***.
* Periodic level
** Range level
*** Psychological level
InstaForex analytical reviews will make you fully aware of market trends! Being an InstaForex client, you are provided with a large number of free services for efficient trading.


