 Stay
Stay 
Trading Conditions
Products
Tools


Trend analysis (Fig. 1).
Today, the market from the level 1.1862 (closing of yesterday's daily candle) may begin moving down with the goal of 1.1819, which is a pullback level of 23.6% (blue dotted line). When testing this level, further work down with the goal of 1.1780, which is a pullback level of 38.2% (blue dotted line).
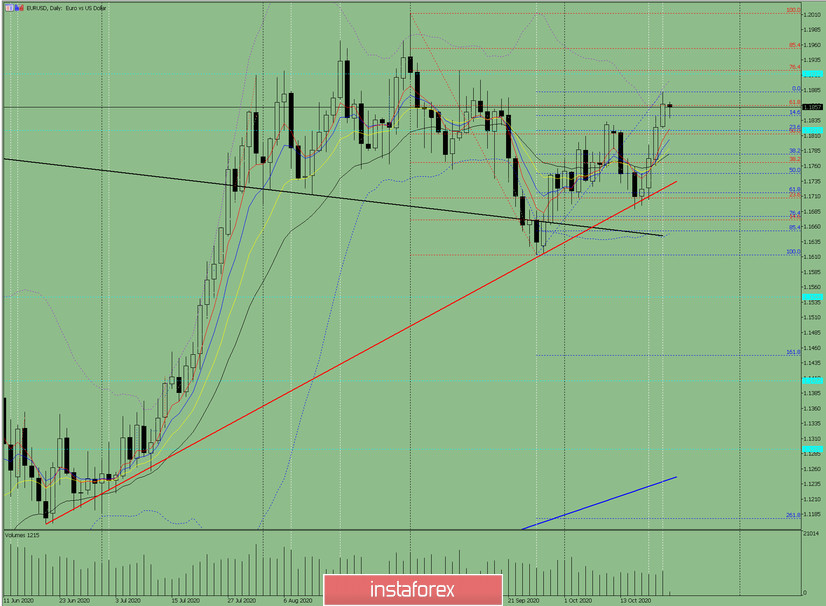
Figure 1 (Daily chart).
Complex analysis:
General conclusion:
Today, the market may start moving down from the level of 1.1862 (closing of yesterday's daily candle) with the target of 1.1819, which is a pullback level of 23.6% (blue dotted line). When testing this level, further work downward with the goal of 1.1780, which is a pullback level of 38.2% (blue dotted line).
Alternative scenario: from the level of 1.1862 (closing of yesterday's daily candle), the price may continue to move down with the target of 1.18144, which is a pullback level of 14.6% (blue dotted line). When testing this level, further work up with the goal of 1.1882 - the upper fractal (blue dotted line).
InstaForex analytical reviews will make you fully aware of market trends! Being an InstaForex client, you are provided with a large number of free services for efficient trading.

