 Stay
Stay 
Trading Conditions
Products
Tools


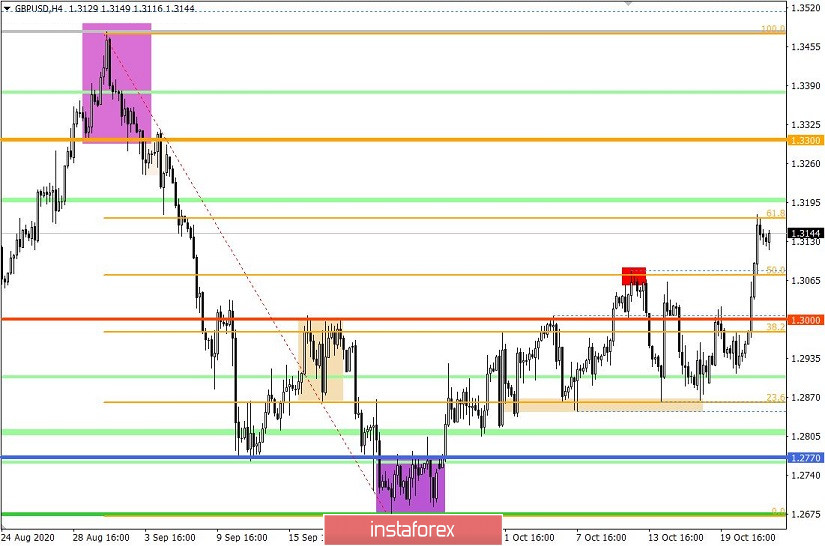
The GBP/USD pair showed a very high activity yesterday, which led to an update of the local high (1.3080) on October 12. Moreover, an inertial move appeared on the market, which was difficult to stop with something.
Such strong changes in the market occur with the help of two components: the information background and speculative hype.
As for the market ticks, the downward trend of the previous month, which was regarded as the first stage of the mid-term trend change, was under attack, as the local high from October 12 was updated. Now, the recovery relative to the decline of 1.3480 ---> 1.2674 is more than 62%, which violates the clock component of the past month.
Analyzing yesterday's fifteen-minute TF, we can see that the upward inertia arose during the Asian session and lasted until 16:15 UTC+00, where coordinates 1.3175 was reached. A stagnation followed, where buyers clearly did not want to retreat.
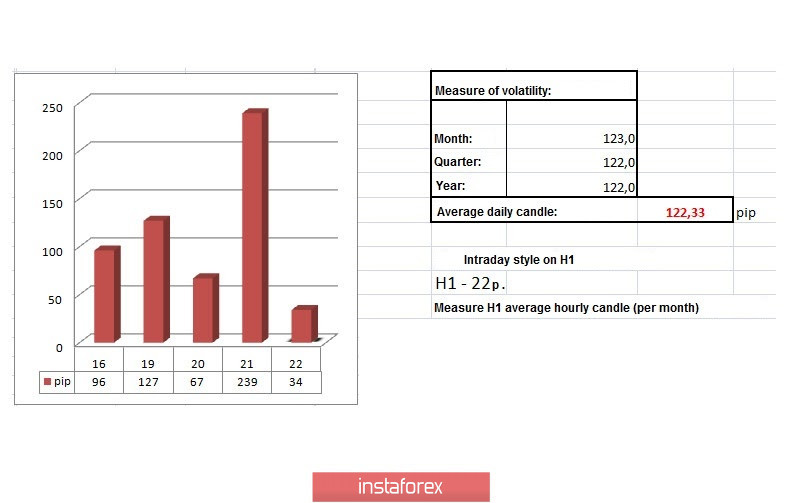
In terms of daily dynamics, the highest indicator for 29 trading days was recorded yesterday. It was 239 points, which is 95% higher than the average volatility level. A notable moment was that there was an unusual decline of 67 points the day before the overactive activity, which became a kind of signal of the upcoming acceleration for many traders.
As discussed in the previous analytical review, traders considered acceleration in the event of a breakout of the local high of October 12 - 1.3080, which led to large price changes.
Considering the trading chart in general terms (daily period), we can see that there are about 300 points left until the full recovery relative to September.
For the news background, there was inflation data in Britain yesterday, where they recorded a rapid growth from 0.2% to 0.5%, against the forecasted 0.4%.
This added optimism for the growth of the pound, but the main speculative impulse fell on the information flow.
So in terms of the information background, we have the Brexit noise, where the parties officially agreed to resume negotiations on a trade agreement, after Mr. Boris Johnson suspended them last Friday.
In turn, EU negotiator Michel Barnier tweeted that there is not enough time and there is a lot of hard work ahead.
From the above material, it is clear that speculators have seized on the topic of resuming negotiations, which can prevent a hard Brexit from the EU.
It is worth considering that speculators will continue to monitor the Brexit topic and any information on the negotiations can give the market new price surges.

In terms of the economic calendar, we have weekly data on claims for unemployment benefits in the US today, where the threshold of 10 million re-claims may be broken, which will serve as a psychological factor for the strengthening of the US dollar.
Reorders can be reduced from 10,018,000 to 9,750,000, while initial applications can be reduced from 898,000 to 915,000.
Further development
Analyzing the current trading chart, a stagnation can be seen within the values of 1.3120/1.3175, where the quote unclearly fluctuates with a high overbought ratio of the pound. In fact, we have a kind of psychological factor that keeps the quote at the peak of the recent inertia, instead of allowing it into a technical correction.
We can assume that without price consolidation above the level of 1.3175 in the H4 TF, long positions will still be fixed in the market, which will lead to a correction towards 1.3080.
The upward development has the following coordinates in the form of values 1.3250-1.3300 in case the local high of 1.3175 does not resist speculators' pressure.
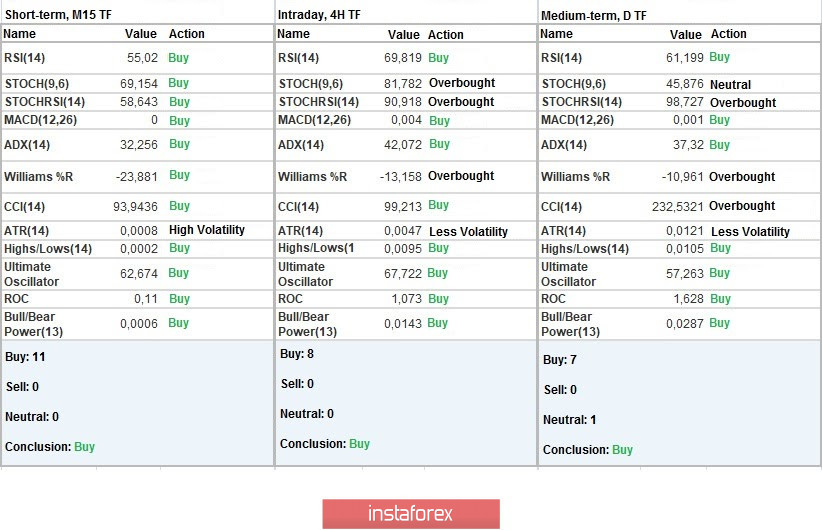
Indicator analysis
Analyzing different sectors of time frames (TF), we see that the technical indicators on the minute and hourly TF have a buy signal due to the price holding at the local high, as well as reflecting the structure of yesterday's inertial movement. The daily TF, in turn, similarly signals a buy due to inertia and price consolidation above the levels of 1.3100.
Weekly volatility / Volatility measurement: Month; Quarter; Year
The volatility measurement reflects the average daily fluctuations, calculated per Month / Quarter / Year.
The dynamics of the current time is 34 points, which is 72% below the average. We are sure that everything is still ahead and there will be an acceleration soon. Thus, it is worth being prepared for sharp price changes.
Key levels
Resistance zones: 1.3200; 1.3300 **; 1.3600; 1.3850; 1.4000 ***; 1.4350 **.
Support zones: 1.3000 ***; 1.2770 **; 1.2620; 1.2500; 1.2350 **; 1.2250; 1.2150 **; 1.2000 *** (1.1957); 1.1850; 1.1660; 1.1450 (1.1411).
* Periodic level
** Range level
*** Psychological level
InstaForex analytical reviews will make you fully aware of market trends! Being an InstaForex client, you are provided with a large number of free services for efficient trading.

