 Stay
Stay 
Trading Conditions
Products
Tools


EUR/USD hourly chart
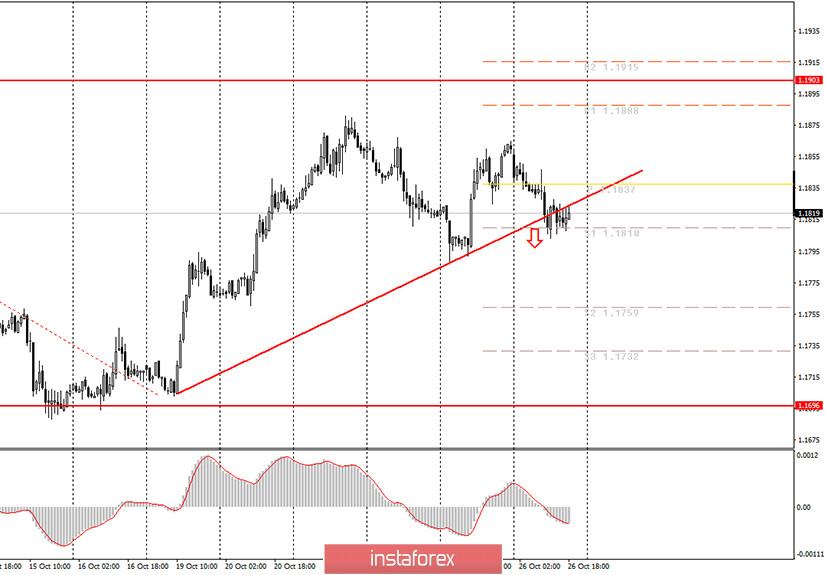
On Monday, October 26, the EUR/USD pair started a new round of the downtrend that was just enough to pass the new ascending trendline. It was the second time that the price failed to rebound from the trendline. This means that at the moment the uptrend has finally come to an end. During the day, there were no clear buy signals, so novice traders should not have opened long positions if they followed our recommendations. Since the price has now crossed the trendline, sell orders have become relevant. However, we do not recommend entering the market in the evening. It is worth noting that the pair has made a reversal in favor of the US currency to the upper boundary of the $1.17-1.19 sideways channel. Therefore, the downward movement should now continue with the target set at the lower boundary of this channel. At the same time, beginners should remember that the pair continues to trade in the flat channel, which means there is no clear trend at the moment. Unexpected movements of the price are also possible within the channel. For example, after today's downtrend, it would be good to wait for a pullback to the upside. Then, you can trace sell signals from the MACD indicator.
Today, no important macroeconomic reports or events were observed in the EU or the US. So, the decline of the euro was mainly determined by technical factors. Several topics remain extremely important for the euro/dollar pair, but they did not have an immediate impact on the pair's trajectory.
On Tuesday, October 27, no economic releases are expected in Europe, while a report on durable goods orders will be published in the US. Last time, the pair moved by no more than 30 pips when this report was released. In general, this data is considered quite important. However, in the past six months, market participants tend to ignore the key macroeconomic data. So, it is quite possible that tomorrow there will be a weak or no reaction at all. Traders should focus on the two main topics instead: the coronavirus in the EU and the US presidential election. With the rising infection cases in Europe, there are more chances that the euro will depreciate. On the other hand, negative news on the US election front will most likely trigger a new round of decline in the US dollar. Negative news may appear in the near future as the elections will take place next Tuesday. This may be followed by long vote counts as well as legal proceedings if one of the candidates refuses to admit his defeat.
Possible scenarios for October 27
1) Buying the EUR/USD is not relevant at the moment, as the bears have managed to break the ascending trendline. Thus, in the near future, the pair should continue the downtrend. You can consider opening buy deals only when a new ascending trend is formed or when a downtrend is completely canceled.
2) Selling the pair has become relevant now, since the price failed to hold above the trendline. Thus, we recommend that novice traders wait for an upward pullback. Then, it will be possible to track sell signals from the MACD indicator which can be tested with the targets at 1.1759 and 1.1732.
On the chart
Support and Resistance Levels are the Levels that serve as targets when buying or selling the pair. You can place Take Profit near these levels.
Red lines are the channels or trendlines that display the current trend and show in which direction it is better to trade now.
Up/down arrows show where you should sell or buy after reaching or breaking through particular levels.
The MACD indicator (14, 22, and 3) consists of a histogram and a signal line. When they cross, this is a signal to enter the market. It is recommended to use this indicator in combination with trend patterns (channels and trendlines).
Important announcements and economic reports that you can always find on the economic calendar can seriously influence the trajectory of a currency pair. Therefore, at the time of their release, we recommend trading as carefully as possible or exit the market in order to avoid sharp price fluctuations.
Beginners on Forex should remember that not every single trade has to be profitable. The development of a clear strategy and money management are the key to success in trading over a long period of time.
InstaForex analytical reviews will make you fully aware of market trends! Being an InstaForex client, you are provided with a large number of free services for efficient trading.


