 Stay
Stay 
Trading Conditions
Products
Tools


To open long positions on EURUSD, you need:
In the first half of the day, I paid attention to purchases from the level of 1.1663 after the breakout and consolidation on it, which happened. However, if you look at the 5-minute chart, things don't get so simple right away. There was a breakdown, however, there is no accentuated entry point on the test of the 1.1663 level from top to bottom. Therefore, I missed this signal and did not manage to earn anything on it.
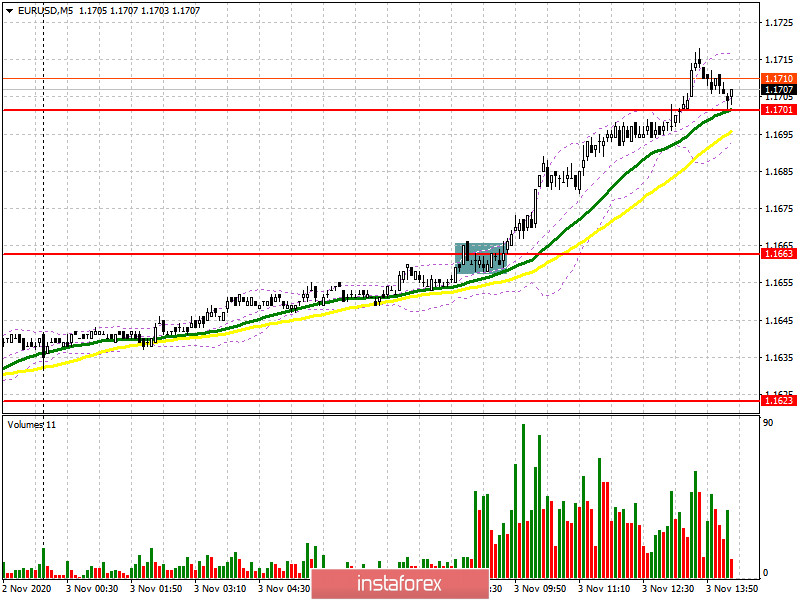
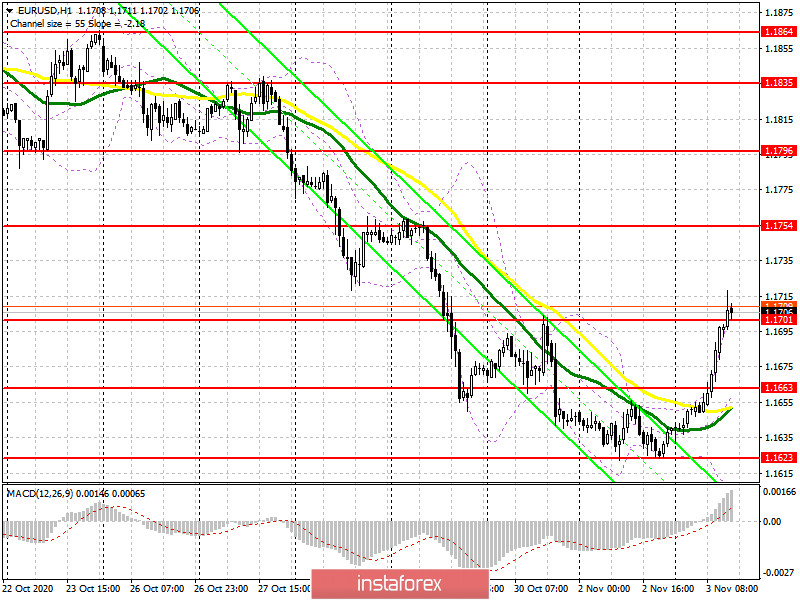
In the second half of the day, the focus is shifted to the resistance of 1.1701. On the hourly chart, you can see that the bulls have fixed above this range and tested it from top to bottom, forming an additional entry point. But it's fair to say that buying on such a signal is quite risky, and be prepared for the fact that the market may turn around at any moment. However, as long as trading is conducted above the range of 1.1701, you can expect the pair to continue strengthening to the area of the maximum of 1.1754, where I recommend taking the profits. If trading returns to the level of 1.1701 and the bears gain a foothold under it, it is better to exit long positions and wait for the update of the larger support of 1.1663, from which you can re-open long positions immediately on the rebound. The formation of a false breakout at 1.1701 will be an additional signal to open long positions in EUR/USD in the expectation of continuing the upward correction.
To open short positions on EURUSD, you need to:
Sellers did not show any activity in the resistance area of 1.1701, and now their main task for the second half of the day will be to return the pair to this range. Its test on the reverse side will be a signal to open short positions to reduce the pair to the area of morning support of 1.1663, where I recommend fixing the profits. It will be possible to count on a larger fall in the euro only following the results of the US presidential election, provided that Trump wins. A break and consolidation below the support of 1.1663 will quickly push the euro to a weekly low of 1.1623, from which the downward movement will continue to the area of 1.1585 and 1.1541. If the demand for the euro continues in the second half of the day, I recommend opening short positions only after updating the maximum of 1.1754 or even higher from the resistance of 1.1796, based on a correction of 20-30 points within the day.
Let me remind you that the COT report (Commitment of Traders) for October 27 recorded a reduction in both long and short positions. But despite this, buyers of risky assets believe in the continuation of the bull market and prefer to act cautiously. Thus, long non-profit positions fell from 229,878 to 217,443, while short non-profit positions also fell to 61,888 from 63,935. The total non-commercial net position fell to 155,555 from 165,943 a week earlier. However, bullish sentiment on the euro remains quite high in the medium term. The stronger the euro declines against the US dollar at the end of this year, the more attractive it will be for new investors, especially after the US presidential election, when additional pressure on the market on this issue will ease.
Signals of indicators:
Moving averages
Trading is conducted above 30 and 50 daily moving averages, which indicates a market break and the beginning of an upward correction.
Note: The period and prices of moving averages are considered by the author on the hourly chart H1 and differ from the general definition of classic daily moving averages on the daily chart D1.
Bollinger Bands
If the pair declines, the average border of the indicator around 1.1663 will provide support.
Description of indicators
InstaForex analytical reviews will make you fully aware of market trends! Being an InstaForex client, you are provided with a large number of free services for efficient trading.

