 Stay
Stay 
Trading Conditions
Products
Tools


Hourly chart of the EUR/USD pair
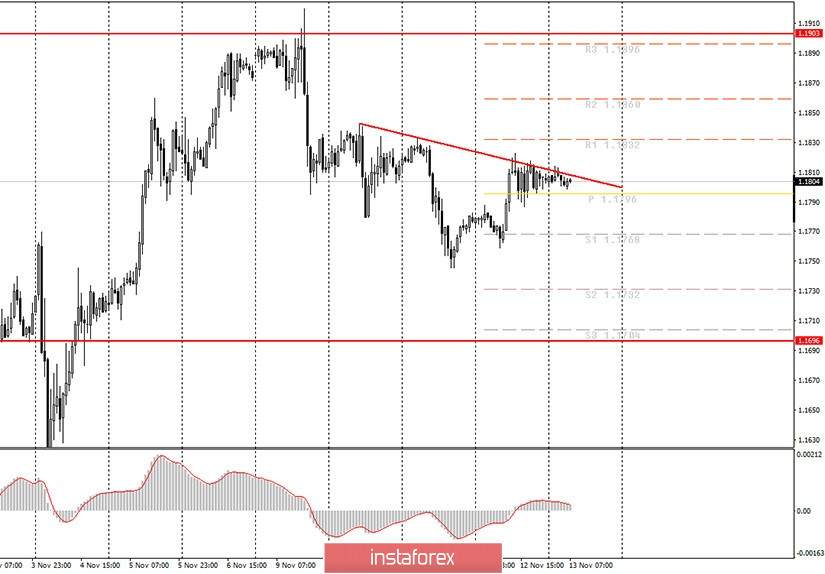
The EUR/USD pair began a very sluggish pullback along the downward trend line last night. Therefore, there is a rather ambiguous situation at the moment. On the one hand, the MACD indicator has generated a new sell signal, while the trend line signals a continuing downward trend. On the other hand, there is no such downward movement. Over the past 18 hours, the pair fell around 10-15 points. So now novice traders can formally trade for a fall, however, the trend will change to an upward one if the price settles above the trend line. Take note that a flat has developed for the euro/dollar pair over the past 24 hours. Besides, the pair has been trading mainly between the levels of 1.1700 and 1.1900 for three consecutive months, which is also flat. Accordingly, there is no trend now either in the long term or in the short term. Given that the downward trend continues, we still believe that the euro will fall to the lower border of the 1.1696 horizontal channel.
Today, we can expect some interesting reports from the European Union. First of all, we advise you to pay attention to the eurozone GDP for the third quarter. Growth is forecast to be 12.7% q/q. If the actual value of the report turns out to be lower, it can help bring back the downward movement. And vice versa. Germany will also publish its GDP report, but it is less significant than the pan-European one. There won't be any important publications in America today. Producer price index and consumer confidence index are clearly not the data that can influence the mood of traders. Therefore, we recommend paying more attention to technical factors today. Now the price is in close proximity to the trend line, which means that in the next few hours this line may be broken or the pair can rebound off it. These phenomena can also be interpreted as signals. In general, we believe that the US dollar has good chances of rising (a decline for EUR/USD). So far, Donald Trump has not moved from words to deeds, so the political crisis in America is gradually subsiding, and the constitutional one is not developing. However, if the current president continues to insist on a revision of the election results, this could create an unfavorable atmosphere for the US dollar.
Possible scenarios for November 13:
1) Buy positions on the EUR/USD pair remain irrelevant at this time. However, if the price settles above the downward trend line, then novice traders are advised to open long positions with targets at 1.1832 and 1.1860, since the trend will change to an upward one in this case. The pair spent the last hours in a flat, so a horizontal movement is also possible.
2) Trading for a fall is still more relevant at this time, as the downward trend continues. Therefore, novice traders are advised to wait for a rebound from the trend line now, and the MACD indicator has already turned to the downside. Therefore, we advise you to sell the pair while aiming for 1.1768 and 1.1732, but do not forget about the Stop Loss levels in case the price settles above the trend line.
On the chart:
Support and Resistance Levels are the Levels that serve as targets when buying or selling the pair. You can place Take Profit near these levels.
Red lines are the channels or trend lines that display the current trend and show in which direction it is better to trade now.
Up/down arrows show where you should sell or buy after reaching or breaking through particular levels.
The MACD indicator (14,22,3) consists of a histogram and a signal line. When they cross, this is a signal to enter the market. It is recommended to use this indicator in combination with trend lines (channels and trend lines).
Important announcements and economic reports that you can always find in the news calendar can seriously influence the trajectory of a currency pair. Therefore, at the time of their release, we recommended trading as carefully as possible or exit the market in order to avoid a sharp price reversal.
Beginners on Forex should remember that not every single trade has to be profitable. The development of a clear strategy and money management are the key to success in trading over a long period of time.
InstaForex analytical reviews will make you fully aware of market trends! Being an InstaForex client, you are provided with a large number of free services for efficient trading.

