 Stay
Stay 
Trading Conditions
Products
Tools


Yesterday, the pair went up and tested the pullback level of 85.4% - 1.1894 (blue dotted line), then the price went down, closing the daily candle at 1.1861. Today, the market may continue to move up according to the economic calendar news, it is expected at 10.00 and 15.00 UTC (Euro), at 13.30 and 15.30 UTC (dollar).
Trend analysis (Fig. 1).
Today, the market will try to continue moving up from the level of 1.1861 (closing of yesterday's daily candle) in order to reach the pullback level of 85.4% - 1.1894 (blue dotted line). If this level will be tested, the upward movement will continue with the next target 1.1920 at the upper fractal (candle from 09.11.2020). After reaching this level, there will be a further work up with the goal of 1.1954 at the upper border of the Bollinger line indicator (black dotted line).
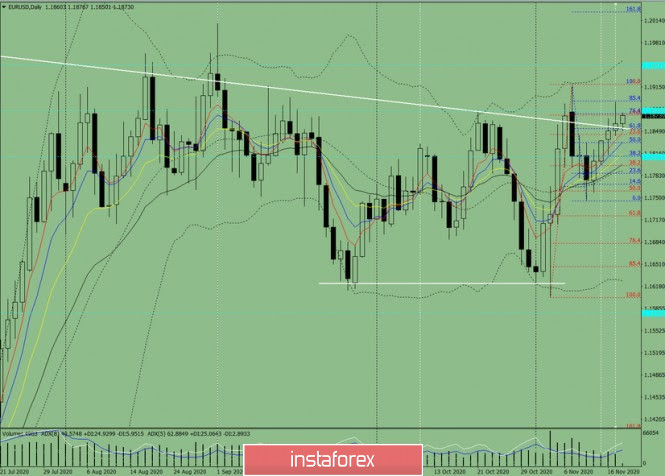
Figure 1 (daily chart).
Complex Analysis:
General conclusion:
Today, the price may continue to move up to reach the pullback level of 85.4% - 1.1894 (blue dotted line). If this level will be tested, the upward movement will continue with the next target 1.1920 at the upper fractal (candle from 09.11.2020). After reaching this level, there will be a further work up with the goal of 1.1954 at the upper border of the Bollinger line indicator (black dotted line).
Unlikely scenario: when moving up and reaching the pullback level of 85.4% - 1.1894 (blue dotted line), the price may start moving down to the pullback level of 23.6% - 1.1844 (red dotted line).
InstaForex analytical reviews will make you fully aware of market trends! Being an InstaForex client, you are provided with a large number of free services for efficient trading.


