 Stay
Stay 
Trading Conditions
Products
Tools


Trend analysis (Fig. 1)
Today, the market will try to start moving up from the level of 1.3259 (the closing of yesterday's daily candle) with the target of 1.3317 which is the resistance line (white bold line). When this line is reached, the price can continue to move up with the goal of 1.3424 which is the upper border of the Bollinger line indicator (black dotted line).
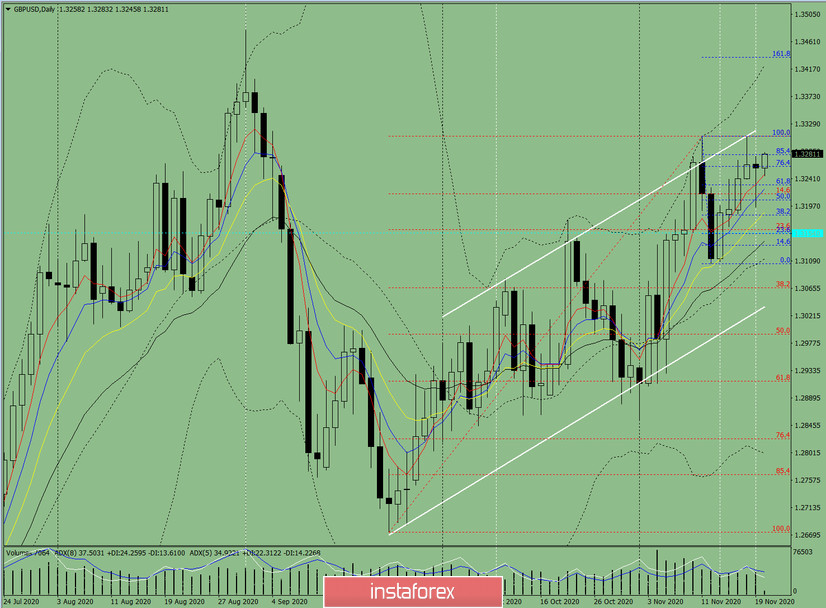
Figure 1 (daily chart)
Complex analysis:
General conclusion:
Today, from the level of 1.3259 (the closing of yesterday's daily candle), the price will try to start moving up with the goal of 1.3317 which is the resistance line (white bold line). When this line is reached, the price can continue to move up with the goal of 1.3424 which is the upper border of the Bollinger line indicator (black dotted line).
Alternative scenario: When moving up and reaching the resistance line 1.3317 (white bold line), the price may start moving down with a target of 1.3214 which is a pullback level of 14.6% (red dotted line).
InstaForex analytical reviews will make you fully aware of market trends! Being an InstaForex client, you are provided with a large number of free services for efficient trading.

