 Stay
Stay 
Trading Conditions
Products
Tools


Trend analysis (Fig. 1).
Today, the market will try to start moving up from the level of 1.3352 (closing of yesterday's daily candle) in order to reach the resistance line of 1.3510 (red bold line). If this level is tested, further move up with the target of 1.3538 which is the upper fractal (blue dotted line).
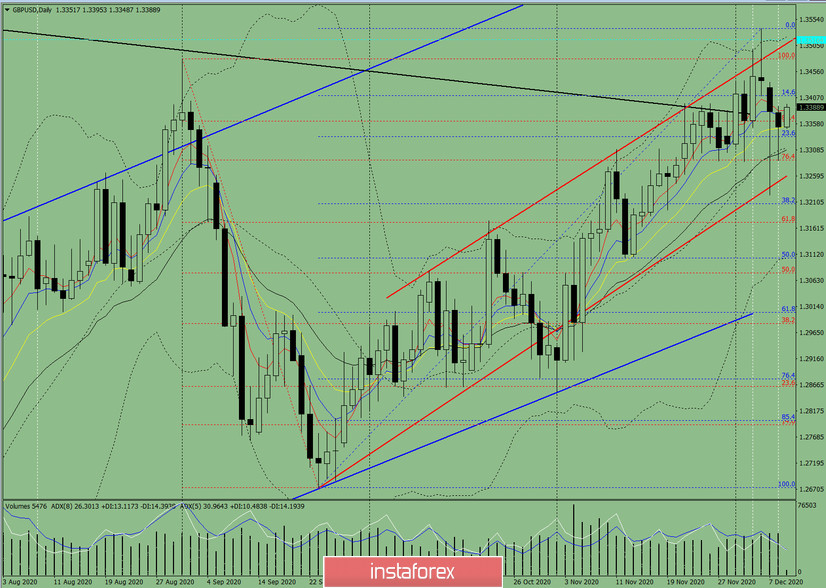
Figure 1 (daily chart).
Complex analysis:
General conclusion:
Today, from the level of 1.3352 (closing of yesterday's daily candle), the price will try to start moving up to reach the resistance line of 1.3510 (red bold line). If this level is tested, further work up with the target of 1.3538 which is the upper fractal (blue dotted line).
Alternative scenario: From the level of 1.3414 (closing of yesterday's daily candle), the price will try to continue moving up to reach the resistance line of 1.3510 (red bold line). If this line is tested, further work down with the target of 1.3411 which is the pullback level of 14.6% (blue dotted line).
InstaForex analytical reviews will make you fully aware of market trends! Being an InstaForex client, you are provided with a large number of free services for efficient trading.


