 Stay
Stay 
Trading Conditions
Products
Tools


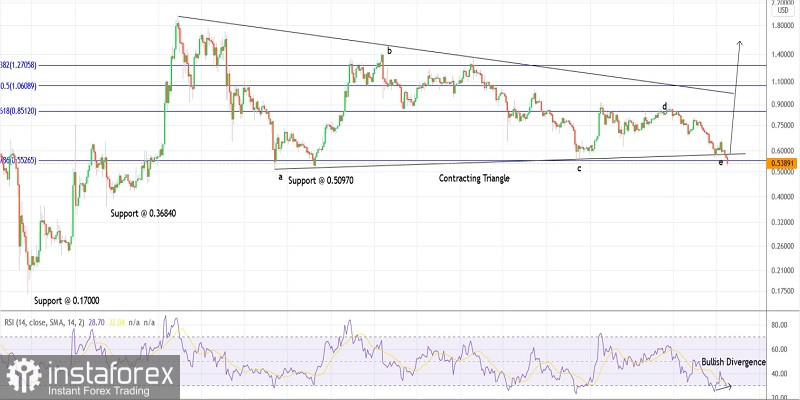
Ripple dropped through $0.5260 on Monday alongside most of its peers. Since then, the crypto has found some bids and is seen to be trading around $0.5330 level at this point in writing. Bulls might be still looking to come back in control and push through the $0.65700 mark, which acts as initial resistance on the daily chart.
Ripple has slipped below the $0.54600 level, which is wave 'c' termination of the proposed contracting triangle. Still the structure continues to remain valid since the $0.50970 support remains intact (wave 'a' termination). A bullish turn from the current prices would keep the structure constructive towards $0.65700 in the near term.
Furthermore, Ripple has produced a bullish divergence on the daily RSI as shown here. The price action towards $0.52600 has not been supported by a new low in the RSI. This phenomenon could be seen as a potential trend reversal and a break above the $0.65700 initial resistance will confirm the same.
Potential rally through $0.65700 against $0.50970 near term
Good luck!
InstaForex analytical reviews will make you fully aware of market trends! Being an InstaForex client, you are provided with a large number of free services for efficient trading.


