 Stay
Stay 
Trading Conditions
Products
Tools


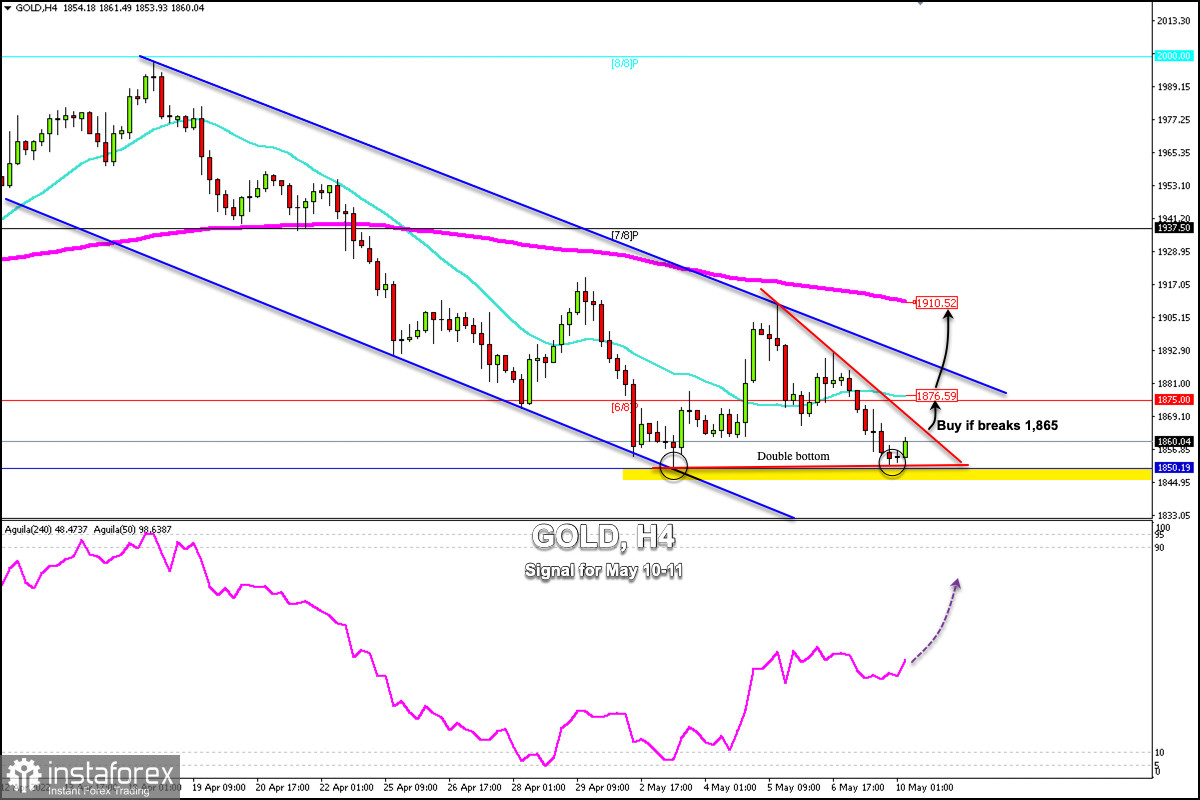
Gold (XAU/USD) in the Asian session reached the level of 1,852.40. This level coincides with the low of May 03 at 1,851.
US Treasuries hit new highs in years and continue to head higher. At the same time, equity markets are under bearish pressure and the US dollar remains firm. These factors show that investors prefer safe-haven assets.
A change from the peace talks between Russia and Ukraine and an increase in fear of a nuclear attack could rekindle investors' appetite for gold as a safe haven. If this happens, it could favor a recovery above 1,910 and the metal could quickly reach the psychological level of $2,000.
If in the next few hours gold manages to defend the support of 1,851, it could be a confirmation of a double bottom pattern which could be a positive sign for gold and we could expect a recovery towards the 21 SMA located at 1,876.
On the 4-hour chart, we can see the formation of a symmetrical triangle, though this pattern needs confirmation. A sharp break to the upside above 1,865 could be a positive sign. A close on the 4-hour chart above 1,877 could signal that bearish pressure is easing and the price could reach the 200 EMA at 1,910.
On the contrary, if gold closes and consolidates below 1,850 in the next few hours, it is likely to reach the zone of 5/8 Murray at 1,812.
Our trading plan for the next few hours is to buy gold above 1,851 or in case of a break of the symmetrical triangle above 1,865 with targets at 1,876 (21 SMA) and 1,910 (200 EMA). The eagle indicator is giving a positive signal which supports our bullish strategy.
InstaForex analytical reviews will make you fully aware of market trends! Being an InstaForex client, you are provided with a large number of free services for efficient trading.


