 Stay
Stay 
Trading Conditions
Products
Tools


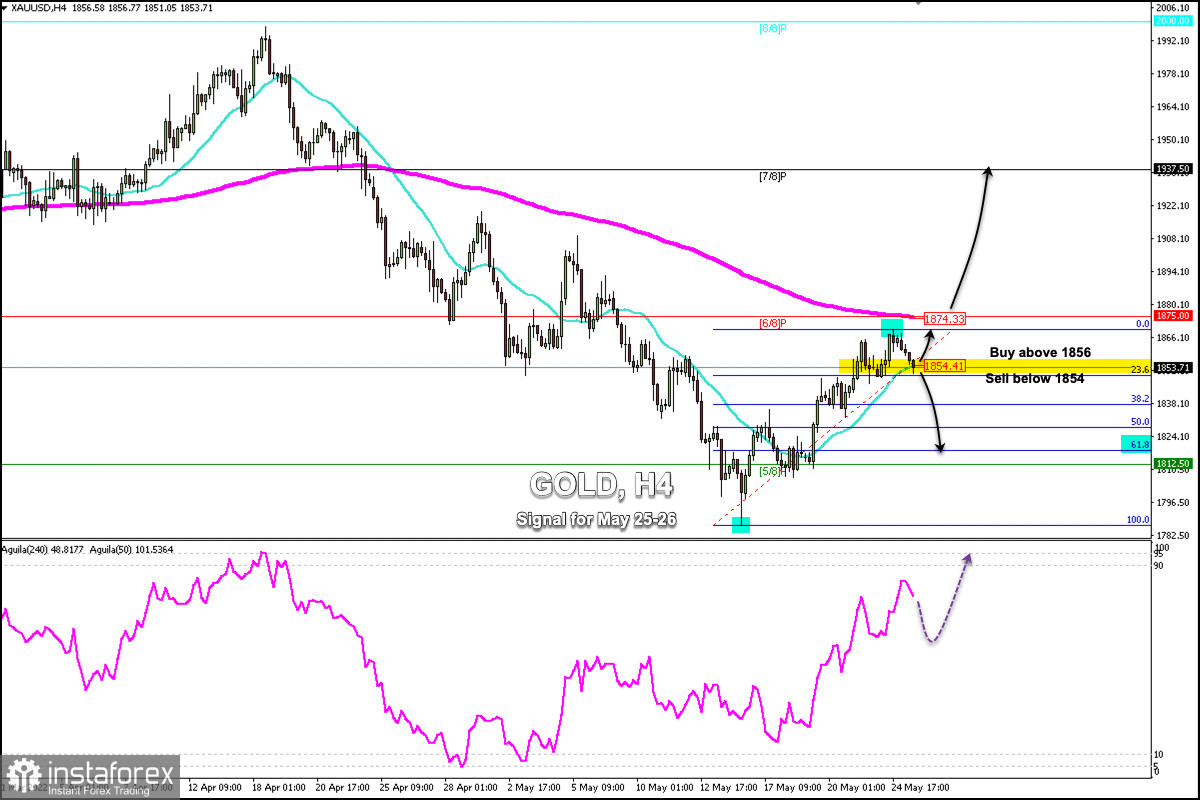
Early in the American session, Gold (XAU/USD) is trading around the 21 SMA located at 1,854. After having reached a high in the zone 1,869.55, gold is pulling back and is likely to continue its downtrend and could reach the 61.8% Fibonacci level.
Gold has a strong barrier at 6/8 Murray (1,875), where the 200 EMA is additionally located. If the price trades back above 1,856 or around this level, it will act as a strong top.
If the Fed minutes are followed by a positive market reaction, traders should watch for gold to retest the zone 5/8 Murray at 1,812.
The US dollar (USDX) has reversed some of the losses when it hit 101.63. This, in turn, has been considered a key factor weighing on gold prices.
According to the 4-hour chart, gold is at a key point of 1,855. If gold consolidates below this level in the next few hours, it is likely to continue its downward movement and could reach the 38.2% Fibonacci level at around 1,840. In case the downward pressure prevails, the metal could reach the zone 61.8% around 1,818.
Conversely, if gold consolidates above 1,856, it will be a signal to buy, with targets at 1,865 and 1,875. Additionally, a daily close above the 200 EMA and above 6/8 Murray we could expect a bullish movement that could push the price up to 7/8 Murray at 1,937.
Our trading plan for the next few hours is to sell below 1,854 (21 SMA), with targets at 1,841 and 1,820. The eagle indicator is giving a negative signal and a technical correction is likely to occur first for the uptrend to resume.
InstaForex analytical reviews will make you fully aware of market trends! Being an InstaForex client, you are provided with a large number of free services for efficient trading.


