 Stay
Stay 
Trading Conditions
Products
Tools


Ripple is trading in the green at 0.3140 at the time of writing. The bias remains bearish despite minor rebounds. The altcoin could come back to test and retest the near-term resistance level before extending its sell-off.
XRP/USD is down by 2.81% in the last 24 hours and by 2.78% in the last 7 days. Bitcoin's deeper drop after a temporary rebound could push Ripple towards new lows. Technically, after its massive drop, XRP/USD's rebound is natural.
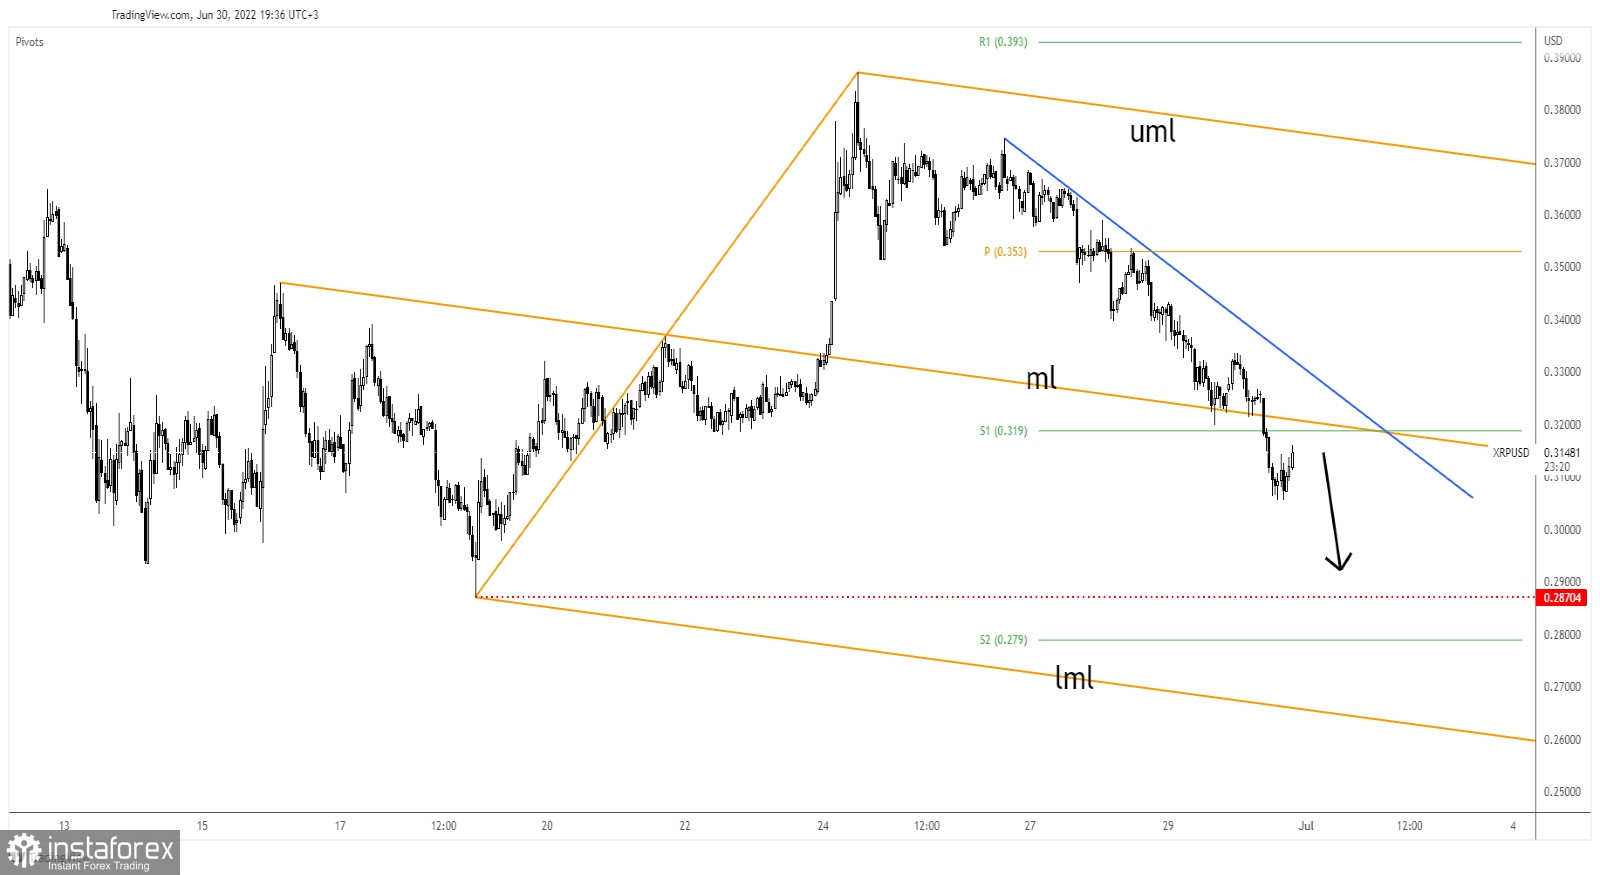
As you can see on the H1 chart, Ripple dropped below the median line (ml) of the descending pitchfork and below the weekly S1 (0.3190) which represented downside obstacles. Now it tries to come back to test and retest the upside obstacles.
The downtrend line represents an upside obstacle as well. As long as it stays below it, Ripple could drop deeper. Only a valid breakout above it may signal a larger growth.
Testing and retesting the median line (ml) or the downtrend line, registering only false breakouts could announce a new sell-off.
Also, a new lower low, dropping and closing below 0.3056 could bring new selling opportunities. The 0.2870 is seen as a downside target.
InstaForex analytical reviews will make you fully aware of market trends! Being an InstaForex client, you are provided with a large number of free services for efficient trading.

