 Stay
Stay 
Trading Conditions
Products
Tools


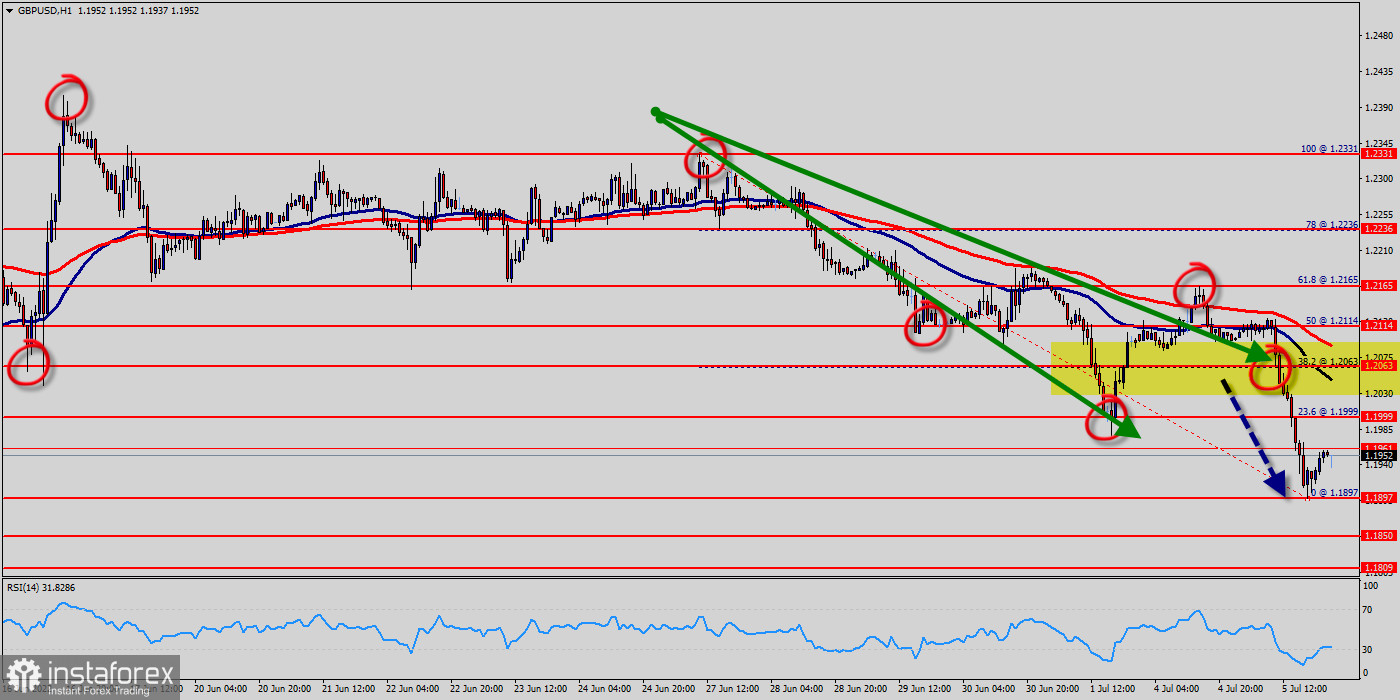
GBP/USD : Immediate support is seen around 1.1952. A clear break below that area could lead price to the neutral zone in the nearest term. Price will test 1.1897, because in general, we remain bearish on July 5th, 2022. Yesterday, the market moved from its top at 1.2165 and continued to fall towards the bottom of 1.1952. Today, on the one-hour chart, the current drop will remain within a framework of correction. However, if the pair fails to pass through the level of 1.1999 (major resistance), the market will indicate a bearish opportunity below the strong resistance level of 1.1999 (the level of 1.1999 coincides with tha ratio of 23.6% Fibonacci retracement). Since there is nothing new in this market, it is not bullish yet. The break of 1.1999 long term support indicates resumption of whole down trend from 1.2223. Next target is bottom price projection of 1.1897. Sustained break there will pave the way to new objective at 1.1809. In any case, outlook will stay bearish as long as 1.2223 resistance holds, in case of recovery.
The GBP/USD pair continues moving downwards from the level of 1.1999 this morning. Today, the first resistance level is currently seen at 1.1999, the price is moving in a bearish channel now. According to the previous events, we expect the GBP/USD pair to trade between 1.1999 and 1.1809.
So, the major support sets at 1.1809, while daily resistance is found at 1.1999. Therefore, the market is likely to show signs of a bearish trend around the spot of 1.1999. In other words, sell orders are recommended below the spot of 1.1999 with the first target at the level of 1.1897 and continue towards 1.1850 in order to test the weekly support 1 on the H1 chart.
The market will decline further to 1.1809. This would suggest a bearish market because the RSI indicator is still in a negative area and does not show any trend-reversal signs. The pair is expected to drop lower towards at least 1.1809 in order to test the third support (1.1809) in coming days.
On the other hand, if the GBP/USD pair succeeds to break through the weekly pivot point level of 1.2063 today, the market will move upwards continuing the development of the bullish trend to the level 1.2331 (double top).
InstaForex analytical reviews will make you fully aware of market trends! Being an InstaForex client, you are provided with a large number of free services for efficient trading.


