 Stay
Stay 
Trading Conditions
Products
Tools


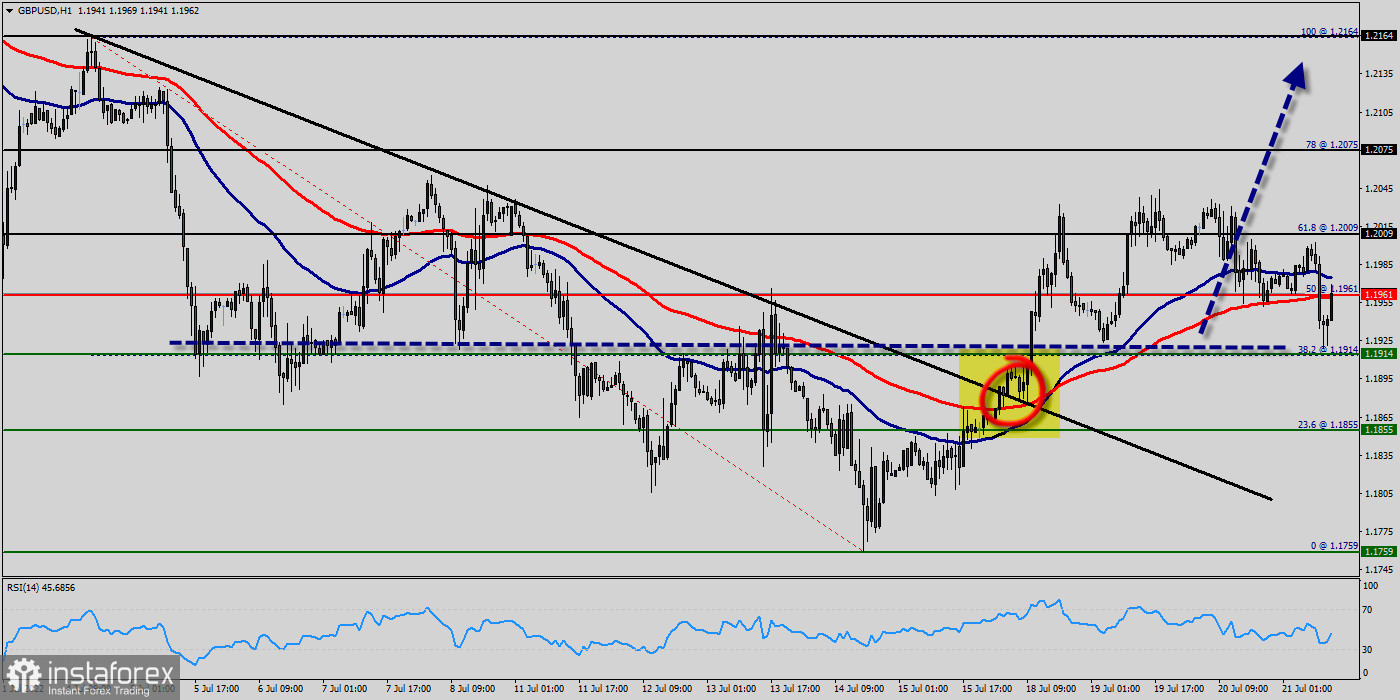
The GBP/USD pair is staying in range of 1.1914 - 1.2009 and intraday bias remains uptrend. Focus remains on 1.2009 minor resistance. Firm break there will confirm long term high at 1.2009. Bias will be continued back to the upside for 1.2075 resistance next.
The GBP/USD pair swing around the breached resistance of the bullish channel and keeps its stability above it until now, noticing that the EMA50 continues to resistance the price from above, while RSI begins to overlap positively.
Therefore, these factors encourage us to continue suggesting the bullish trend for the upcoming period, which its next target located at 1.2075, while holding above 1.2075 represents key condition to achieve the waited targets.
The expected trading range for today is between 1.1914 support and 1.2075 resistance.
The British pound to US dollar exchange rate is one of the most liquid currency pairs in the FX market. The narrow bid-ask spreads, volume and volatility all contribute to why the GBP/USD pairing is so popular to trade. It is one of the most cash-rich currency pairs available as well as being the third most traded major currency pair globally.
On the one-hour chart, the GBP/USD pair continues moving in a bullish trend from the support levels of 1.1914 and 1.1900.
Currently, the price is in a bullish channel. This is confirmed by the RSI indicator signaling that we are still in a bullish trending market.
As the price is still above the moving average (100), immediate support is seen at 1.1914, which coincides with a key ratio (38% of Fibonacci).
Consequently, the first support is set at the level of 1.1914. So, the market is likely to show signs of a bullish trend around the area of 1.1914/1.1900.
Buy orders are recommended above the ratio (1.1914) with the first target at the level of 1.2009. Furthermore, if the trend is able to breakout through the first resistance level of 1.2009.
We should see the pair climbing towards the double top (1.2075) to test it. It would also be wise to consider where to place a stop loss; this should be set below the second support of 1.1914.
On the downside, below 1.1914 will resume larger down trend to 38.2% of Fibonacci retracement levels of 1.1914 to 1.1855 from 1.1855 at 1.1759 in order to reach the last bearish wave.
InstaForex analytical reviews will make you fully aware of market trends! Being an InstaForex client, you are provided with a large number of free services for efficient trading.

