 Stay
Stay 
Trading Conditions
Products
Tools


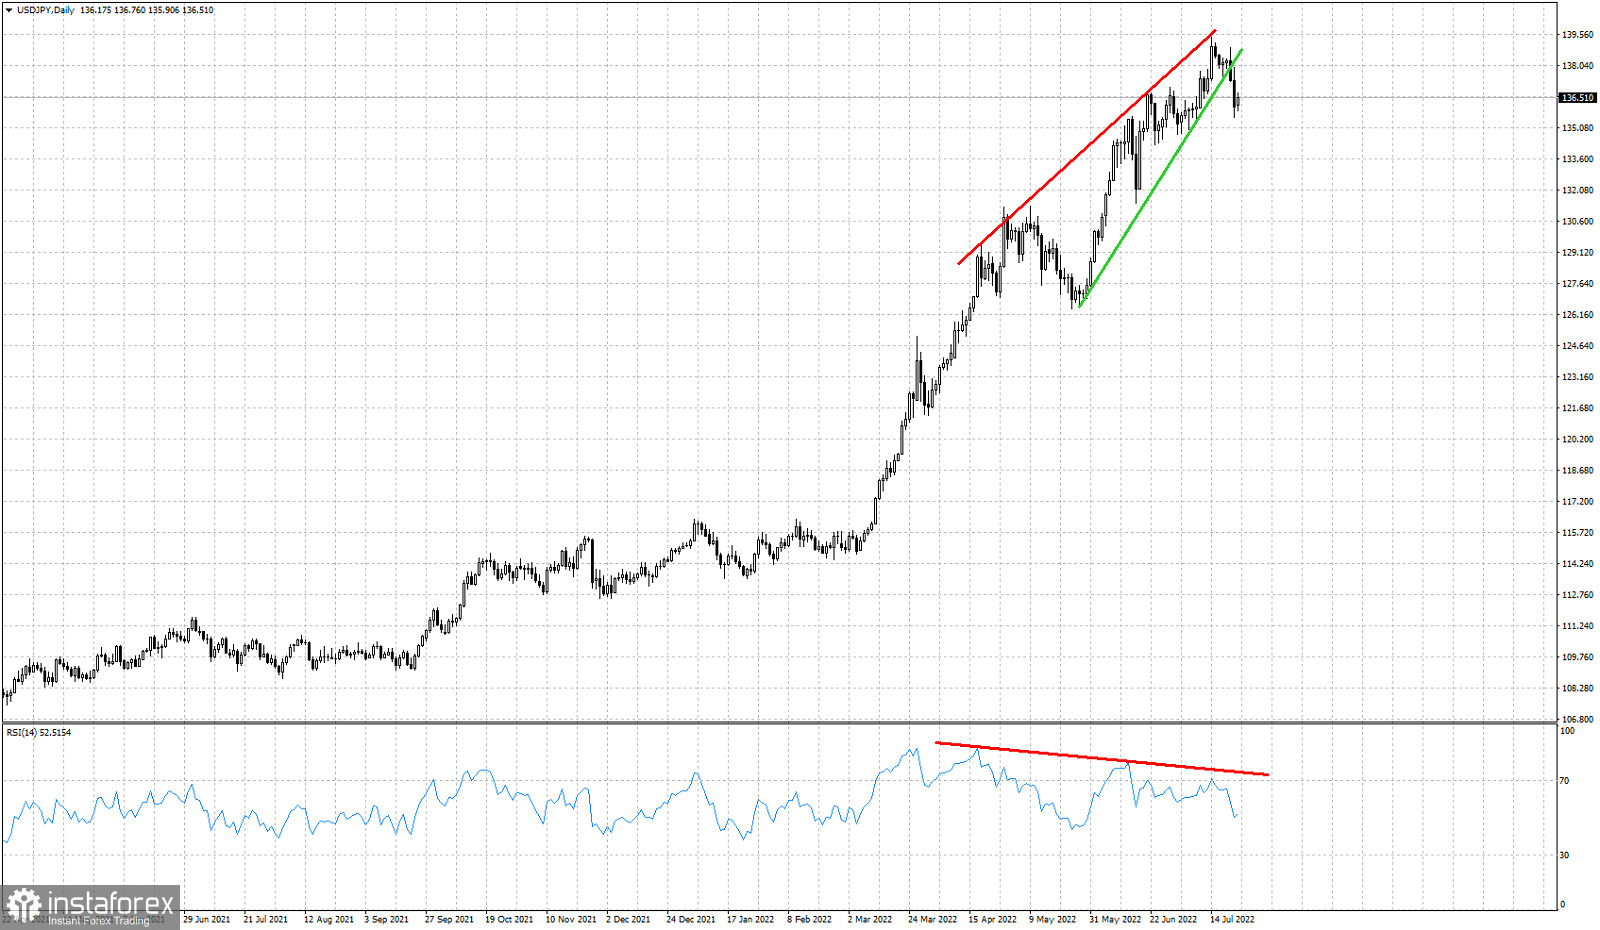
Red lines- bearish RSI divergence
Green line- support trend line
USDJPY recently provided us with a bearish signal as price broke out of a topping formation. Price made a high at 139.40 and provided the bearish signal once the support at 137.90 was broken. Price is now around 136.50. The green and red lines also form a wedge pattern. A break below the lower wedge boundary provided us with the bearish signal. In cases like this, the pull back usually reaches the start of the wedge pattern. In this case the start of the wedge pattern is around 126-127. It is too early to tell if we will see these levels, but the potential is there. A break below 134.70 would be a bearish sign that would increase the chances of a deeper pull back. The next key support therefor is at 134.70. I expect to see a test of this support area over the coming days. Resistance is at 137.30-137.80. Previous support is now resistance. The RSI from overbought levels is slowly moving lower. We have a lot of way towards the oversold levels, with the RSI making lower lows and lower highs. This is another reason why I expect to see lower levels in USDJPY.
InstaForex analytical reviews will make you fully aware of market trends! Being an InstaForex client, you are provided with a large number of free services for efficient trading.

