 Stay
Stay 
Trading Conditions
Products
Tools


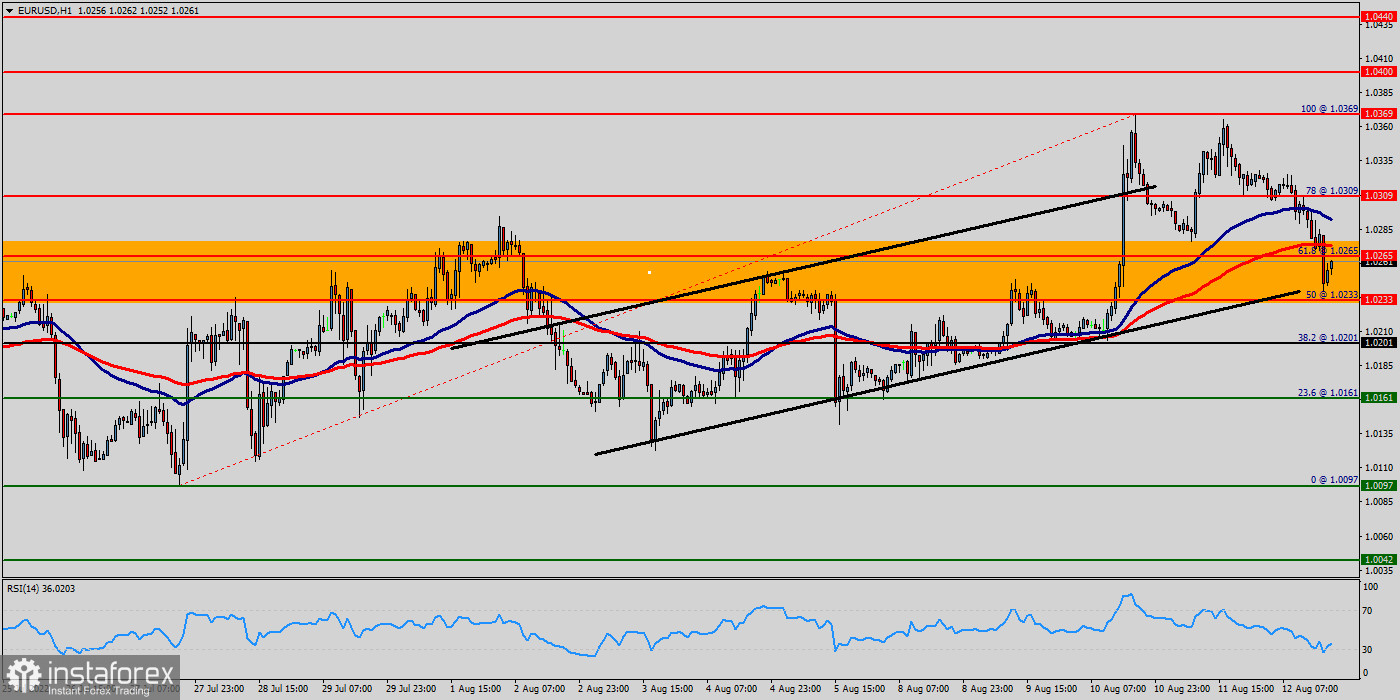
The EUR/USD pair will continue to rise from the level of 1.0233 in the long term. It should be noted that the support is established at the level of 1.0233 which represents the daily pivot point on the H1 chart.
The EUR/USD pair hit the weekly pivot point and resistance 1 (1.0233), because of the series of relatively equal highs and equal lows. The pair fell down in order to bottom at the point of 1.0233.
Hence, the major support was already set at the level of 1.0233. Moreover, the double bottom is also coinciding with the major support this week.
The price is likely to form a double bottom in the same time frame. Accordingly, the EUR/USD pair is showing signs of strength following a breakout of the highest level of 1.0265.
So, buy above the level of 1.0265 with the first target at 1.0309 in order to test the daily resistance 1. The level of 1.0369 is a good place to take profits.
Moreover, the RSI is still signaling that the trend is upward as it remains strong above the moving average (100). This suggests that the pair will probably go up in coming hours.
This is confirmed by the RSI indicator signaling that we are still in the bullish trending market. Now, the pair is likely to begin an ascending movement to the point of 1.0369.
Additionally, the RSI is still calling for a strong bullish market as well as the current price is also above the moving average 100.
If the trend is able to break the level of 1.0369, then the market will call for a strong bullish market towards the objective of 1.0400 today.
On the other hand, in case a reversal takes place and the EUR/USD pair breaks through the support level of 1.0233, a further decline to 1.0201 can occur. It would indicate a bearish market.
InstaForex analytical reviews will make you fully aware of market trends! Being an InstaForex client, you are provided with a large number of free services for efficient trading.


