 Stay
Stay 
Trading Conditions
Products
Tools


Analysis of previous deals:
30M chart of the EUR/USD pair
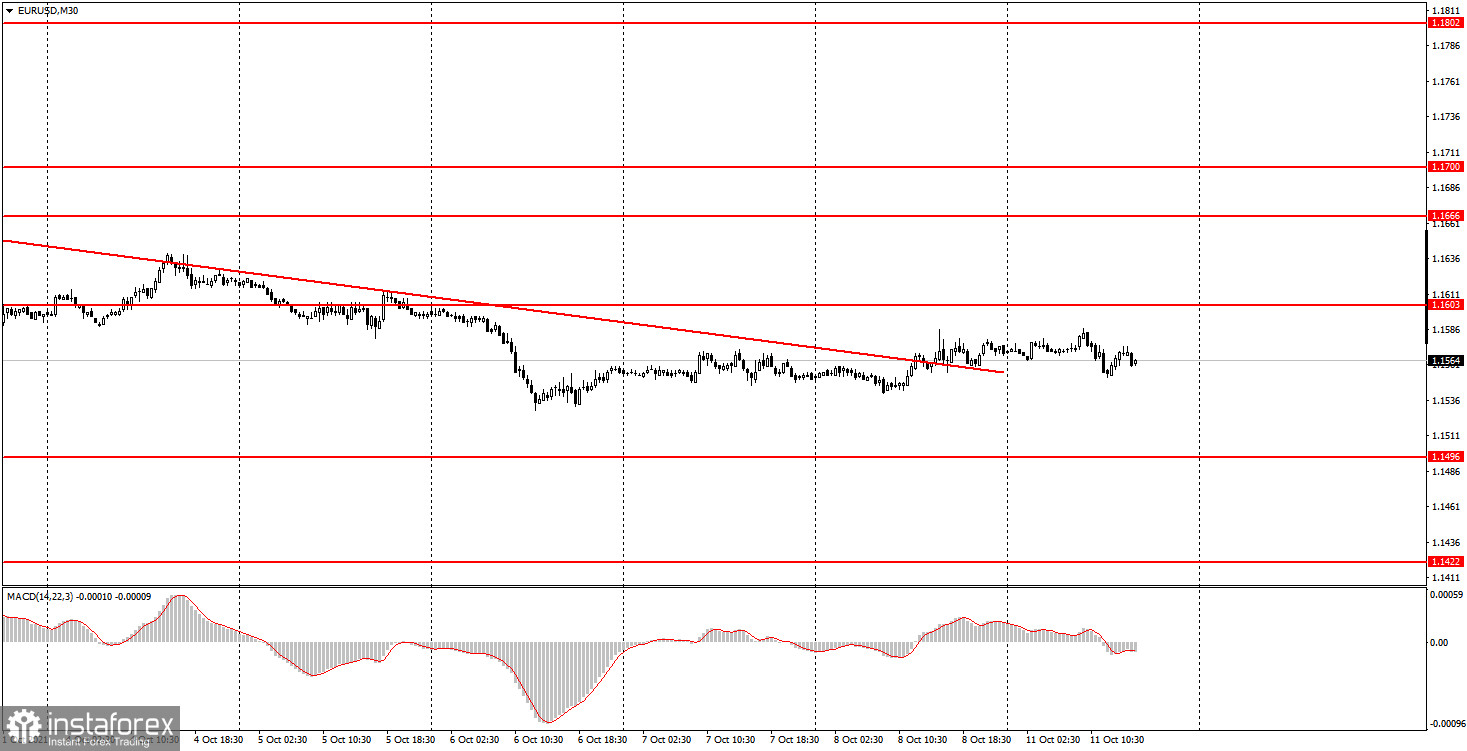
The EUR/USD pair continued to trade in an almost absolute flat on Monday. This was perfectly visible on the 30-minute timeframe. The pair has been trying to correct for the fourth consecutive day, but during this time it could not go up even 70 points (the distance from the local low of 1.1529 to the nearest level of 1.1603). Thus, there was movement in the horizontal channel. And if so, then trading becomes even more difficult due to the influence of this factor. Now not only weak volatility works against traders, but also the absence of any direction of movement. On Monday, by the way, the trouble was not only with the very movements of the EUR/USD pair, but also with macroeconomic reports. No important report or publication, as well as no interesting event. Thus, there was no trend, no new trend line or channel, and there was no movement either.
5M chart of the EUR/USD pair
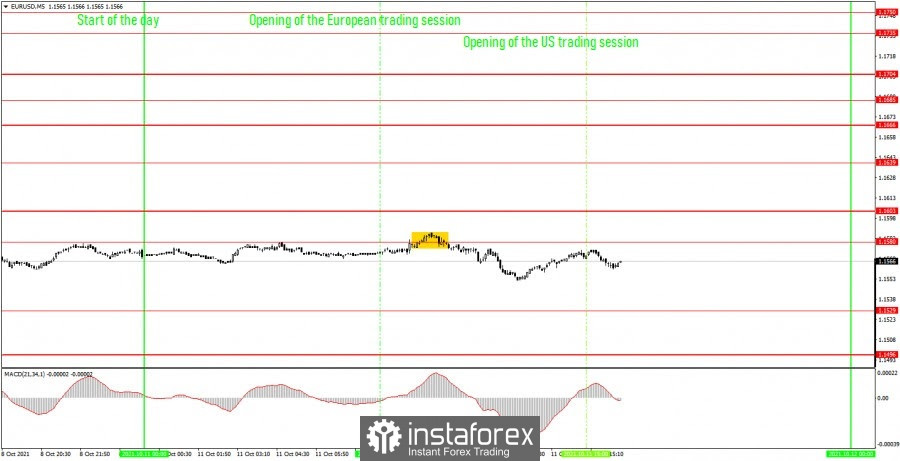
The technical picture on the 5-minute timeframe looks about the same, boring on Monday. At one point, the pair has gone from a day's low to a high of about 34 points. It is possible, of course, that something will change for the better during the US trading session, but, most likely, it is unlikely. Thus, during the day, one trading signal was formed to sell, when the price was not very accurate, but still bounced off the level of 1.1580. At this point, novice traders could have sold the pair. The price in total after the formation of the signal went down about 20 points, which was enough to set Stop Loss to breakeven. That is why the Stop Loss deal was eventually closed, since the quotes returned to the level of 1.1580 at the beginning of the US trading session. Perhaps one or two trading signals will be formed, but the price is unlikely to be able to go in the right direction by at least 30 points, which is necessary for Take Profit. It is unlikely that there will be an interesting movement at all that can be worked out on Monday. At the same time, we remind newbies that no signals are better than an abundance of false signals. With a volatility of 35 points and an absolute flat, no losses were obtained on Monday.
How to trade on Tuesday:
The downward trend was cancelled on the 30-minute timeframe, while the upward trend did not form. In most cases, volatility still does not exceed 40-50 points. Thus, it is still very inconvenient to trade on the 30-minute TF, and we still do not recommend tracking signals from the MACD indicator. On the 5-minute timeframe, the key levels for October 12 are 1.1496, 1.1529, 1.1580, 1.1603, 1.1639, 1.1666. Take Profit, as before, is set at a distance of 30-40 points. Stop Loss - to breakeven when the price passes in the right direction by 15 points. At the 5M TF, the target can be the nearest level if it is not too close or too far away. If it is, then you should act according to the situation or work according to Take Profit. Neither the United States nor the European Union will have a single interesting event on Tuesday. In the US, there will be speeches by representatives of the Federal Reserve, Richard Clarida and Rafael Bostic, but the likelihood that they will report something interesting does not exceed 5%.
On the chart:
Support and Resistance Levels are the Levels that serve as targets when buying or selling the pair. You can place Take Profit near these levels.
Red lines are the channels or trend lines that display the current trend and show in which direction it is better to trade now.
The MACD indicator (14,22,3) consists of a histogram and a signal line. When they cross, this is a signal to enter the market. It is recommended to use this indicator in combination with trend lines (channels and trend lines).
Important speeches and reports (always contained in the news calendar) can greatly influence the movement of a currency pair. Therefore, during their exit, it is recommended to trade as carefully as possible or exit the market in order to avoid a sharp price reversal against the previous movement.
Beginners on Forex should remember that not every single trade has to be profitable. The development of a clear strategy and money management are the key to success in trading over a long period of time.
InstaForex analytical reviews will make you fully aware of market trends! Being an InstaForex client, you are provided with a large number of free services for efficient trading.


